Air Classifier (Altun)
Description
This article describes the Altun and Benzer (2014) model for high efficiency air classifiers.[1]
High efficiency air classifiers may be alternatively described as dynamic or third generation air classifiers.
Model theory
The Altun air classifier model applies the Whiten-Beta efficiency curve to partition particles to the overflow stream:
- [math]\displaystyle{ E_{\rm oa}(\bar d_i) = C \left [ \dfrac{ \left (1 + \beta \beta^* \dfrac{\bar d_i}{d_{\rm 50c}} \right )(\exp (\alpha) - 1)}{\exp \left ( \alpha \beta^* \dfrac{\bar d_i}{d_{\rm 50c}} \right ) + \exp (\alpha) - 2} \right ] }[/math]
where:
- [math]\displaystyle{ i }[/math] is the index of the size interval, [math]\displaystyle{ i = \{1,2,\dots,n\} }[/math], [math]\displaystyle{ n }[/math] is the number of size intervals
- [math]\displaystyle{ E_{\rm oa}(\bar d_i) }[/math] is the fraction of particles of size interval [math]\displaystyle{ i }[/math] in the feed reporting to the overflow stream (frac)
- [math]\displaystyle{ \bar d_{i} }[/math] is the geometric mean size of particles in size interval [math]\displaystyle{ i }[/math] (mm)
- [math]\displaystyle{ d_{\rm 50c} }[/math] is the corrected size at which 50% of the particle mass reports to underflow and 50% to overflow (mm)
- [math]\displaystyle{ C }[/math] is the fraction of feed liquids (or fines) split to overflow (frac)
- [math]\displaystyle{ \alpha }[/math] is a parameter representing the sharpness of separation
- [math]\displaystyle{ \beta }[/math] is a term introduced to accommodate the so-called fish-hook effect, and controls the initial rise in the efficiency curve at finer sizes
- [math]\displaystyle{ \beta^* }[/math] is computed to ensure the Whiten-Beta function preserves the definition of [math]\displaystyle{ d_{\rm 50c} }[/math] in the presence of the fish-hook, i.e. [math]\displaystyle{ E = 0.5 C }[/math] at [math]\displaystyle{ d_{\rm 50c} }[/math]
Additional relations link terms of the efficiency curve equation with operating parameters.
Corrected cut size
The corrected cut size, [math]\displaystyle{ d_{50 \rm c} }[/math] (mm), is:
- [math]\displaystyle{ d_{50 \rm c} = k_{d_{50 \rm c}} \left ( \dfrac{\mathit{AF}}{ 3600 . \mathit{RS}.F} \right )^{n_{d_{50 \rm c}}} }[/math]
where:
- [math]\displaystyle{ \mathit{AF} }[/math] is the classifier air flow rate (m3/h)
- [math]\displaystyle{ \mathit{RS} }[/math] is the rotor speed of the classifier (m/s)
- [math]\displaystyle{ F }[/math] is the flow rate of -36+3 µm size particles in the feed (t/h)
- [math]\displaystyle{ k_{d_{50 \rm c}} }[/math] and [math]\displaystyle{ n_{d_{50 \rm c}} }[/math] are the coefficient and exponent, respectively, of the cut size equation.
Sharpness of separation
The sharpness of separation term, [math]\displaystyle{ \alpha }[/math], is estimated by:
- [math]\displaystyle{ \alpha = k_{\alpha} \left ( \dfrac{D}{\mathit{DL}} \right )^{n_{\alpha}} }[/math]
where:
- [math]\displaystyle{ D }[/math] is the classifier chamber diameter (m)
- [math]\displaystyle{ \mathit{DL} }[/math] is the dust loading of the classifier feed (kg/m3)
- [math]\displaystyle{ k_{\alpha} }[/math] and [math]\displaystyle{ n_{\alpha} }[/math] are the coefficient and exponent, respectively, of the sharpness of separation equation.
The dust loading, [math]\displaystyle{ \mathit{DL} }[/math] (kg/m3), is calculated from the feed and air flow rates:
- [math]\displaystyle{ \mathit{DL} = \dfrac{ 1000 . (Q_{\rm M,F})_{\rm S}}{\mathit{AF}} }[/math]
where [math]\displaystyle{ (Q_{\rm M,F})_{\rm S} }[/math] is the mass flow rate of solids in the feed (t/h)
Fines bypass
The fraction of the finest particles reporting to overflow, [math]\displaystyle{ C }[/math] (frac), is:
- [math]\displaystyle{ C = \dfrac{100 - k_C (\mathit{DL})^{n_C}}{100} }[/math]
where [math]\displaystyle{ k_C }[/math] and [math]\displaystyle{ n_C }[/math] are the coefficient and exponent, respectively, of the fines bypass equation.
Fish-hook parameter
The parameter controlling the initial rise of the efficiency curve in fines sizes (fish-hook), [math]\displaystyle{ \beta }[/math], is:
- [math]\displaystyle{ \beta = k_{\beta} \mathit{DL}^{n_{\beta}} - c_{\beta} }[/math]
where [math]\displaystyle{ k_{\beta} }[/math], [math]\displaystyle{ n_{\beta} }[/math] and [math]\displaystyle{ c_{\beta} }[/math] are the coefficient, exponent and constant, respectively, of the fish-hook equation.
Altun and Benzer (2014) also provide an equation for the [math]\displaystyle{ \beta^* }[/math] term of the efficiency equation. However, Whiten's definition of [math]\displaystyle{ \beta^* }[/math] requires its value to be computed in complement to the specified value of [math]\displaystyle{ \beta }[/math] in the efficiency equation (see Partition (Size, Whiten-Beta) for more information).
Therefore, the [math]\displaystyle{ \beta^* }[/math] equation is excluded from this implementation of Altun and Benzer's (2014) air classifier model.
Equation parameters
Altun and Benzer's (2014) test work was conducted on a range of Sepol, Sepax and Sepmaster industrial scale dynamic air classifiers. The parameter values in Table 1 were derived by regression analyses of their industrial sampling results.
Table 1. Air classifier model equation parameters (after Altun and Benzer, 2014).[1] Equation Coefficient, [math]\displaystyle{ k }[/math] Exponent, [math]\displaystyle{ n }[/math] Constant, [math]\displaystyle{ c }[/math] [math]\displaystyle{ \alpha }[/math] 0.905 1.2679 - [math]\displaystyle{ d_{50 \rm c} }[/math] 0.4048 0.7775 - [math]\displaystyle{ C }[/math] 10.467 1.4171 - [math]\displaystyle{ \beta }[/math] 0.4417 1.4171 0.1293
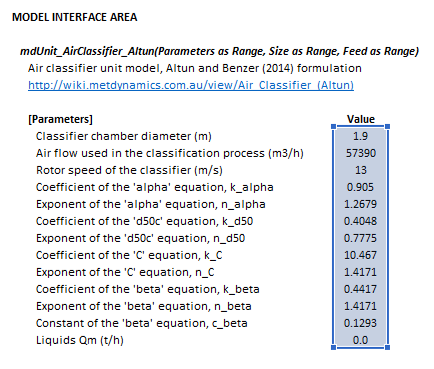
This implementation of the air classifier model allows a user to specify the values of the equation coefficients, exponents and constants directly. Altun and Benzer's (2014) values may be used, or new values derived from specific industrial or laboratory test work programmes.
Additional notes
Altun and co-workers have published subsequent journal articles outlining similar model treatments for multi-component feeds, where particle density differences and agglomeration are observed to affect classification performance.[2][3]
However, this work was only conducted on laboratory scale equipment (Alpine 100 MZR) rather than operating industrial air classifiers. Additional non-standard material measurements are also required (e.g. fluidity index). As such, these model implementations are not included here.
Excel
The Altun air classifier model may be invoked from the Excel formula bar with the following function call:
=mdUnit_AirClassifier_Altun(Parameters as Range, Size as Range, Feed as Range)
Invoking the function with no arguments will print Help text associated with the model, including a link to this page.
Inputs
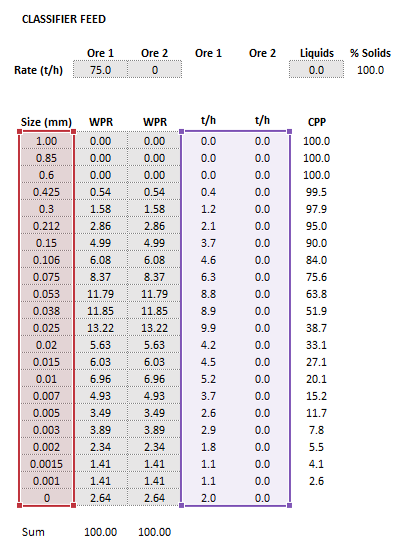
The required inputs are defined below in matrix notation with elements corresponding to cells in Excel row ([math]\displaystyle{ i }[/math]) x column ([math]\displaystyle{ j }[/math]) format:
- [math]\displaystyle{ Parameters= \begin{bmatrix} D\text{ (m)}\\ \mathit{AF}\text{ (m}^3\text{/h)}\\ \mathit{RS}\text{ (m/s)}\\ k_{\alpha}\\ n_{\alpha}\\ k_{d_{50}}\\ n_{d_{50}}\\ k_{C}\\ n_{C}\\ k_{\beta}\\ n_{\beta}\\ c_{\beta}\\ (Q_{\rm M,F})_{\rm L}\text{ (t/h)}\\ \end{bmatrix},\;\;\;\;\;\; Size = \begin{bmatrix} d_{1}\text{ (mm)}\\ \vdots\\ d_p\text{ (mm)}\\ \end{bmatrix},\;\;\;\;\;\; Feed= \begin{bmatrix} (Q_{\rm M,F})_{11}\text{ (t/h)} & \dots & (Q_{\rm M,F})_{1m}\text{ (t/h)}\\ \vdots & \ddots & \vdots\\ (Q_{\rm M,F})_{p1}\text{ (t/h)} & \dots & (Q_{\rm M,F})_{pm}\text{ (t/h)}\\ \end{bmatrix},\;\;\;\;\;\; }[/math]
where:
- [math]\displaystyle{ p }[/math] is the number of size intervals
- [math]\displaystyle{ m }[/math] is the number of ore types
- [math]\displaystyle{ d_i }[/math] is the size of the square mesh interval that mass is retained on (mm)
- [math]\displaystyle{ d_{i+1}\lt d_i\lt d_{i-1} }[/math], i.e. descending size order from top size ([math]\displaystyle{ d_{1} }[/math]) to sub mesh ([math]\displaystyle{ d_{p}=0 }[/math] mm)
- [math]\displaystyle{ (Q_{\rm M,F})_{\rm L} }[/math] is the mass flow rate of liquids in the feed (t/h)
Results
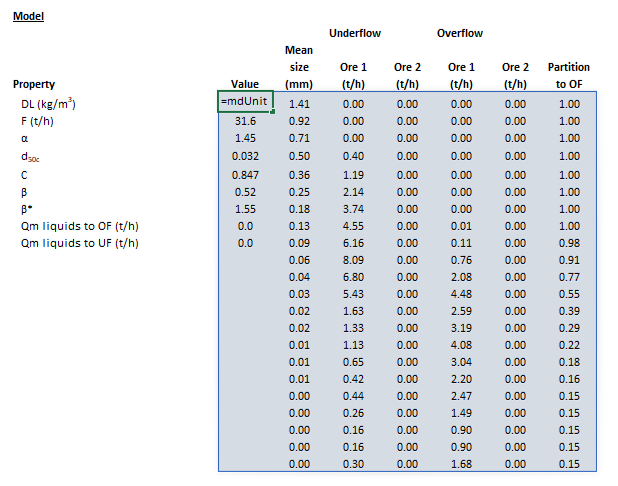
The results are displayed in Excel as an array corresponding to the matrix notation below:
- [math]\displaystyle{ \mathit{mdUnit\_AirClassifier\_Altun} = \begin{bmatrix} \begin{bmatrix} \mathit{DL}\text{ (kg/m}^3\text{)}\\ F\text{ (t/h)}\\ \alpha\\ d_{\rm 50c}\text{ (mm)}\\ C\text{ (frac)}\\ \beta\\ \beta^*\\ (Q_{\rm M,OF})_{\rm L}\text{ (t/h)}\\ (Q_{\rm M,UF})_{\rm L}\text{ (t/h)}\\ \end{bmatrix} \begin{array}{cccccc} \begin{bmatrix} \bar d_1\text{ (mm)}\\ \vdots\\ \bar d_p\text{ (mm)} \end{bmatrix} & \begin{bmatrix} (Q_{\rm M,UF})_{11}\text{ (t/h)} & \dots & (Q_{\rm M,UF})_{1m}\text{ (t/h)}\\ \vdots & \ddots & \vdots\\ (Q_{\rm M,UF})_{p1}\text{ (t/h)} & \dots & (Q_{\rm M,UF})_{pm}\text{ (t/h)}\\ \end{bmatrix} & \begin{bmatrix} (Q_{\rm M,OF})_{11}\text{ (t/h)} & \dots & (Q_{\rm M,OF})_{1m}\text{ (t/h)}\\ \vdots & \ddots & \vdots\\ (Q_{\rm M,OF})_{p1}\text{ (t/h)} & \dots & (Q_{\rm M,OF})_{pm}\text{ (t/h)}\\ \end{bmatrix} & \begin{bmatrix} (E_{\rm oa})_1\text{ (frac)}\\ \vdots\\ (E_{\rm oa})_p\text{ (frac)} \end{bmatrix} \\ \\ \\ \\ \\ \\ \\ \end{array} \end{bmatrix} }[/math]
where:
- [math]\displaystyle{ (Q_{\rm M,OF})_{\rm L} }[/math] is the mass flow rate of liquids to the overflow stream (t/h)
- [math]\displaystyle{ (Q_{\rm M,UF})_{\rm L} }[/math] is the mass flow rate of liquids to the underflow stream (t/h)
Example
The images below show the selection of input arrays and output results in the Excel interface.
SysCAD
See also
References
- ↑ 1.0 1.1 Altun, O. and Benzer, H., 2014. Selection and mathematical modelling of high efficiency air classifiers. Powder Technology, 264, pp.1-8.
- ↑ Altun, O., Toprak, A., Benzer, H. and Darilmaz, O., 2016. Multi component modelling of an air classifier. Minerals Engineering, 93, pp.50-56.
- ↑ Altun, O., 2022. Air classification performances of the components within the varied feed blends. Powder Technology, 399, p.117092.


