imported>Scott.Munro |
imported>Scott.Munro |
| Line 5: |
Line 5: |
| == Model theory == | | == Model theory == |
|
| |
|
| | {{Restricted content}} |
| | |
| | <hide> |
| The ''method of mass flow errors'' is applied to estimate the solids split and recovery of multiple assayed components to an arbitrary number of product streams.{{Greet (2010)}} | | The ''method of mass flow errors'' is applied to estimate the solids split and recovery of multiple assayed components to an arbitrary number of product streams.{{Greet (2010)}} |
|
| |
|
| Line 96: |
Line 99: |
|
| |
|
| The scaling factors applied in either case are arbitrary, and should be selected to reflect the relative "importance" or "confidence" of the component measurement. | | The scaling factors applied in either case are arbitrary, and should be selected to reflect the relative "importance" or "confidence" of the component measurement. |
| | </hide> |
|
| |
|
| == Excel == | | == Excel == |
Revision as of 11:39, 4 December 2024
Description
This article describes a methodology for estimating the solids mass split and recovery of multiple assayed components from a process step with any number of product streams.
Model theory
 This content is available to registered users. Please log in to view. This content is available to registered users. Please log in to view.
|
Excel
The n-product formula may be invoked from the Excel formula bar with the following function call:
=mdMassBal_nProductFormula(Assays as Range, Optional AbsSD as Range, Optional Transposed as Boolean = False)
Invoking the function with no arguments will print Help text associated with the model, including a link to this page.
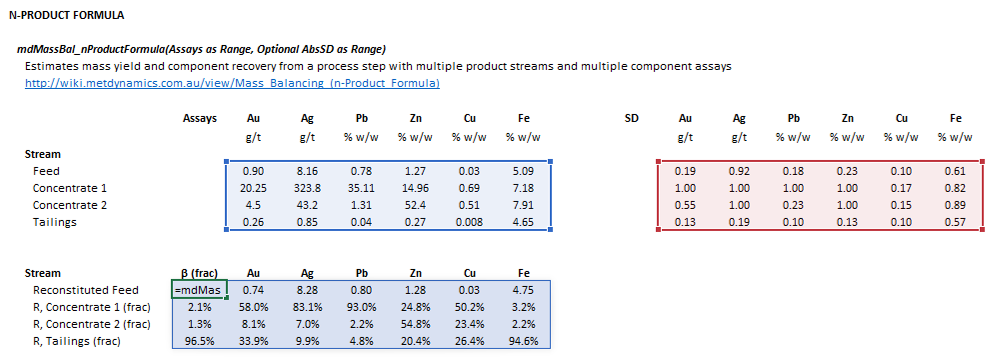
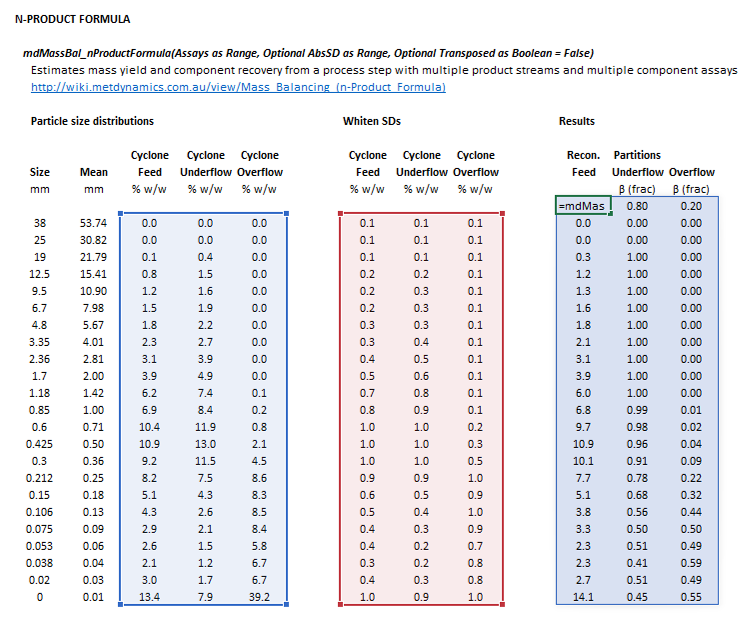
The input parameters and calculation results are defined below in matrix notation, along with example images showing the selection of the same cells and arrays in the Excel interface.
Default
The following default arrangement of inputs and results ranges apply when the formula argument Transposed is false or omitted:
- [math]\displaystyle{
\begin{align}
\mathit{Assay} & =
\begin{bmatrix}
f_1 & \cdots & f_m\\
p_{11} & \cdots & p_{m1}\\
\vdots & \ddots & \vdots\\
p_{1n} & \cdots & p_{mn}\\
\end{bmatrix}\\
\\
\mathit{AbsSD} & =
\begin{bmatrix}
\sigma_{\rm f1} & \cdots & \sigma_{{\rm f}m}\\
\sigma_{11} & \cdots & \sigma_{m1}\\
\vdots & \ddots & \vdots\\
\sigma_{1n} & \cdots & \sigma_{mn}\\
\end{bmatrix}\\
\end{align} }[/math]
|
- [math]\displaystyle{
\begin{align}
\mathit{mdMassBal\_nProductFormula} & =
\begin{bmatrix}
\beta_{\rm f}\text{ (frac)} & \hat{f}_1\text{ (frac)} & \cdots & \hat{f}_m\text{ (frac)}\\
\beta_1\text{ (frac)} & R_{11}\text{ (frac)} & \cdots & R_{m1}\text{ (frac)}\\
\vdots & \vdots & \ddots & \vdots\\
\beta_n\text{ (frac)} & R_{1n}\text{ (frac)} & \cdots & R_{mn}\text{ (frac)}\\
\end{bmatrix}
\end{align}
}[/math]
|
|
where:
- [math]\displaystyle{ \beta_{\rm f} }[/math] is total mass fraction of solids in the feed (frac), i.e. [math]\displaystyle{ \beta_{\rm f} = \sum\nolimits_i^n {\beta_i} = 1 }[/math]
- the unweighted sum of squares approach is used if [math]\displaystyle{ AbsSD }[/math] is omitted.
|
|
 Figure 1. Example showing the selection of the Assay (blue frame), AbsSD (red frame), and Results (light blue frame) arrays in Excel.
|
Transposed
The following arrangement of inputs and results ranges apply when the formula argument Transposed is true:
- [math]\displaystyle{
\begin{align}
\mathit{Assay} & =
\begin{bmatrix}
f_1 & p_{11} & \cdots & p_{1n}\\
\vdots & \vdots & \ddots\\
f_m & p_{1m} & \cdots & p_{mn}\\
\end{bmatrix}\\
\\
\mathit{AbsSD} & =
\begin{bmatrix}
\sigma_{{\rm f} 1} & \sigma_{11} & \cdots & \sigma_{1n}\\
\vdots & \vdots & \ddots\\
\sigma_{{\rm f} m} & \sigma_{1m} & \cdots & \sigma_{mn}\\
\end{bmatrix}\\
\end{align} }[/math]
|
- [math]\displaystyle{
\begin{align}
\mathit{mdMassBal\_nProductFormula} & =
\begin{bmatrix}
\beta_{\rm f}\text{ (frac)} & \beta_1\text{ (frac)} & \cdots & \beta_n\text{ (frac)}\\
\hat{f}_1\text{ (frac)} & R_{11}\text{ (frac)} & \cdots & R_{1n}\text{ (frac)}\\
\vdots & \vdots & \ddots & \vdots\\
\hat{f}_m\text{ (frac)} & R_{m1}\text{ (frac)} & \cdots & R_{mn}\text{ (frac)}\\
\end{bmatrix}
\end{align}
}[/math]
|
|
|
|
 Figure 2. Example showing the selection of the Assay (blue frame), AbsSD (red frame), and Results (light blue frame) arrays in Excel when [math]\displaystyle{ \mathit{Transposed} = \mathrm{True} }[/math].
|
See also
References

