Air Classifier (Altun): Difference between revisions
Jump to navigation
Jump to search
Scott Munro (talk | contribs) m (1 revision imported) |
md>Scott.Munro m (→Excel) |
||
| Line 8: | Line 8: | ||
== Excel == | == Excel == | ||
The Altun air classifier model may be invoked from the Excel formula bar with the following function call: | The Altun air classifier model may be invoked from the Excel formula bar with the following function call: | ||
| Line 16: | Line 14: | ||
{{Excel (Text, Help, No Arguments)}} | {{Excel (Text, Help, No Arguments)}} | ||
=== Inputs === | |||
{{Excel (Text, Inputs)}} | |||
:<math>Parameters= | |||
\begin{bmatrix} | |||
D\text{ (m)}\\ | |||
\mathit{AF}\text{ (m}^3\text{/h)}\\ | |||
\mathit{RS}\text{ (m/s)}\\ | |||
k_{\alpha}\\ | |||
n_{\alpha}\\ | |||
k_{d_{50}}\\ | |||
n_{d_{50}}\\ | |||
k_{C}\\ | |||
n_{C}\\ | |||
k_{\beta}\\ | |||
n_{\beta}\\ | |||
c_{\beta}\\ | |||
(Q_{\rm M,F})_{\rm L}\text{ (t/h)}\\ | |||
\end{bmatrix},\;\;\;\;\;\; | |||
Size = \begin{bmatrix} | |||
d_{1}\text{ (mm)}\\ | |||
\vdots\\ | |||
d_p\text{ (mm)}\\ | |||
\end{bmatrix},\;\;\;\;\;\; | |||
Feed= \begin{bmatrix} | |||
(Q_{\rm M,F})_{11}\text{ (t/h)} & \dots & (Q_{\rm M,F})_{1m}\text{ (t/h)}\\ | |||
\vdots & \ddots & \vdots\\ | |||
(Q_{\rm M,F})_{n1}\text{ (t/h)} & \dots & (Q_{\rm M,F})_{nm}\text{ (t/h)}\\ | |||
\end{bmatrix},\;\;\;\;\;\; | |||
OreSG= \begin{bmatrix} | |||
(\rho_{\rm S})_{1}\text{ (t/m}^\text{3}\text{)} & \dots & (\rho_{\rm S})_m\text{ (t/m}^\text{3}\text{)}\\ | |||
\end{bmatrix} | |||
</math> | |||
where: | |||
* <math>D</math> is the classifier chamber diameter (m) | |||
* <math>\mathit{AF}</math> is the air flow rate (m<sup>3</sup>/h) | |||
* <math>\mathit{RS}</math> is rotor speed (m/s) | |||
* <math>k</math> is an equation coefficient | |||
* <math>n</math> is an equation exponent | |||
* <math>c</math> is an equation constant | |||
* <math>(Q_{\rm M,F})_{\rm L}</math> is the mass flow rate of liquids in the feed (t/h)' | |||
* <math>p</math> is the number of size intervals | |||
* <math>m</math> is the number of ore types | |||
* <math>d_i</math> is the size of the square mesh interval that mass is retained on (mm) | |||
* <math>d_{i+1}<d_i<d_{i-1}</math>, i.e. descending size order from top size (<math>d_{1}</math>) to sub mesh (<math>d_{p}=0</math> mm) | |||
* <math>\rho_{\rm S}</math> is the density of solids (t/m<sup>3</sup>) | |||
=== Results === | |||
The results are displayed in Excel as an array corresponding to the matrix notation below: | |||
:<math> | |||
\mathit{mdUnit\_AirClassifier\_Altun} = | |||
\begin{bmatrix} | |||
\begin{bmatrix} | |||
\mathit{DL}\text{ (kg/m}^3\text{)}\\ | |||
F\text{ (t/h)}\\ | |||
\alpha\\ | |||
d_{\rm 50c}\text{ (mm)}\\ | |||
C\text{ (frac)}\\ | |||
\beta\\ | |||
\beta^*\\ | |||
(Q_{\rm M,OF})_{\rm L}\text{ (t/h)}\\ | |||
(Q_{\rm M,UF})_{\rm L}\text{ (t/h)}\\ | |||
\end{bmatrix} | |||
\begin{array}{cccccc} | |||
\begin{bmatrix} | |||
\bar d_1\text{ (mm)}\\ | |||
\vdots\\ | |||
\bar d_n\text{ (mm)} | |||
\end{bmatrix} | |||
& | |||
\begin{bmatrix} | |||
(Q_{\rm M,UF})_{11}\text{ (t/h)} & \dots & (Q_{\rm M,UF})_{1m}\text{ (t/h)}\\ | |||
\vdots & \ddots & \vdots\\ | |||
(Q_{\rm M,UF})_{n1}\text{ (t/h)} & \dots & (Q_{\rm M,UF})_{nm}\text{ (t/h)}\\ | |||
\end{bmatrix} | |||
& | |||
\begin{bmatrix} | |||
(Q_{\rm M,OF})_{11}\text{ (t/h)} & \dots & (Q_{\rm M,OF})_{1m}\text{ (t/h)}\\ | |||
\vdots & \ddots & \vdots\\ | |||
(Q_{\rm M,OF})_{n1}\text{ (t/h)} & \dots & (Q_{\rm M,OF})_{nm}\text{ (t/h)}\\ | |||
\end{bmatrix} | |||
& | |||
\begin{bmatrix} | |||
(P_{\rm OF})_1\text{ (frac)}\\ | |||
\vdots\\ | |||
(P_{\rm OF})_n\text{ (frac)} | |||
\end{bmatrix} | |||
\\ | |||
\\ | |||
\\ | |||
\\ | |||
\\ | |||
\\ | |||
\\ | |||
\end{array} | |||
\end{bmatrix} | |||
</math> | |||
where: | |||
* <math>\mathit{DL}</math> is the dust loading (kg/m<sup>3</sup>) | |||
* <math>F</math> is the flow rate of -36+3 µm size particles in the feed (t/h) | |||
* <math>\alpha</math> is the sharpness parameter of the [[Partition (Size, Whiten-Beta)|Whiten-Beta]] efficiency curve | |||
* <math>d_{\rm 50c}</math> is the cut size parameter of the [[Partition (Size, Whiten-Beta)|Whiten-Beta]] efficiency curve (mm) | |||
* <math>C</math> is the bypass parameter of the [[Partition (Size, Whiten-Beta)|Whiten-Beta]] efficiency curve (frac) | |||
* <math>\beta</math> is a fish-hook parameter of the [[Partition (Size, Whiten-Beta)|Whiten-Beta]] efficiency curve | |||
* <math>\beta^*</math> is a fish-hook parameter of the [[Partition (Size, Whiten-Beta)|Whiten-Beta]] efficiency curve | |||
* <math>(Q_{\rm M,OF})_{\rm L}</math> is the mass flow rate of liquids to the overflow stream (t/h) | |||
* <math>(Q_{\rm M,UF})_{\rm L}</math> is the mass flow rate of liquids to the underflow stream (t/h) | |||
* <math>P_{\rm OF}</math> is the partition fraction to overflow (frac) | |||
=== Example === | |||
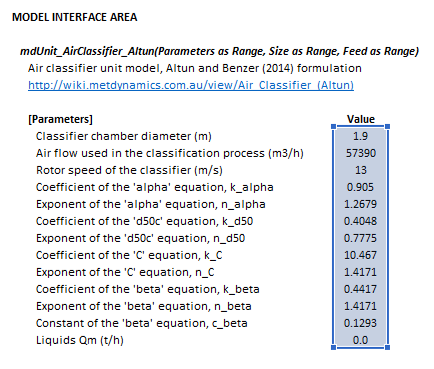
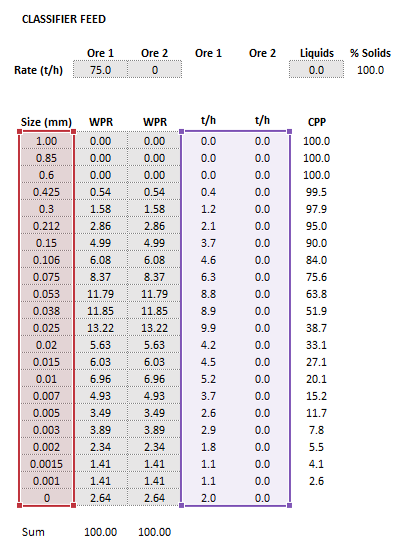
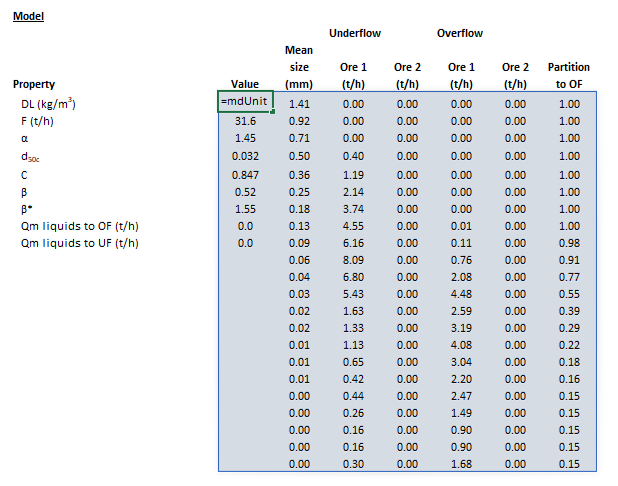
The images below show the selection of input arrays and output results in the Excel interface. | |||
{| | |||
|- style="vertical-align:top;" | |||
| [[File:AirClassifierAltun1.png|left|frame|Figure 1. Example showing the selection of the '''Parameters''' (blue frame) array in Excel.]] | |||
| [[File:AirClassifierAltun2.png|left|frame|Figure 2. Example showing the selection of the '''Size''' (red frame), '''OreSG''' (green frame) and '''Feed''' (purple frame) arrays in Excel.]] | |||
| [[File:AirClassifierAltun3.png|left|frame|Figure 3. Example showing the selection of the '''Results''' (light blue frame) array in Excel.]] | |||
|} | |||
== SysCAD == | == SysCAD == | ||
Revision as of 09:06, 15 May 2023
Description
This article describes the Altun and Benzer (2014) model for air classification.[1]
Model theory
Excel
The Altun air classifier model may be invoked from the Excel formula bar with the following function call:
=mdUnit_AirClassifier_Altun(Parameters as Range, Size as Range, Feed as Range, OreSG Range)
Invoking the function with no arguments will print Help text associated with the model, including a link to this page.
Inputs
The required inputs are defined below in matrix notation with elements corresponding to cells in Excel row ([math]\displaystyle{ i }[/math]) x column ([math]\displaystyle{ j }[/math]) format:
- [math]\displaystyle{ Parameters= \begin{bmatrix} D\text{ (m)}\\ \mathit{AF}\text{ (m}^3\text{/h)}\\ \mathit{RS}\text{ (m/s)}\\ k_{\alpha}\\ n_{\alpha}\\ k_{d_{50}}\\ n_{d_{50}}\\ k_{C}\\ n_{C}\\ k_{\beta}\\ n_{\beta}\\ c_{\beta}\\ (Q_{\rm M,F})_{\rm L}\text{ (t/h)}\\ \end{bmatrix},\;\;\;\;\;\; Size = \begin{bmatrix} d_{1}\text{ (mm)}\\ \vdots\\ d_p\text{ (mm)}\\ \end{bmatrix},\;\;\;\;\;\; Feed= \begin{bmatrix} (Q_{\rm M,F})_{11}\text{ (t/h)} & \dots & (Q_{\rm M,F})_{1m}\text{ (t/h)}\\ \vdots & \ddots & \vdots\\ (Q_{\rm M,F})_{n1}\text{ (t/h)} & \dots & (Q_{\rm M,F})_{nm}\text{ (t/h)}\\ \end{bmatrix},\;\;\;\;\;\; OreSG= \begin{bmatrix} (\rho_{\rm S})_{1}\text{ (t/m}^\text{3}\text{)} & \dots & (\rho_{\rm S})_m\text{ (t/m}^\text{3}\text{)}\\ \end{bmatrix} }[/math]
where:
- [math]\displaystyle{ D }[/math] is the classifier chamber diameter (m)
- [math]\displaystyle{ \mathit{AF} }[/math] is the air flow rate (m3/h)
- [math]\displaystyle{ \mathit{RS} }[/math] is rotor speed (m/s)
- [math]\displaystyle{ k }[/math] is an equation coefficient
- [math]\displaystyle{ n }[/math] is an equation exponent
- [math]\displaystyle{ c }[/math] is an equation constant
- [math]\displaystyle{ (Q_{\rm M,F})_{\rm L} }[/math] is the mass flow rate of liquids in the feed (t/h)'
- [math]\displaystyle{ p }[/math] is the number of size intervals
- [math]\displaystyle{ m }[/math] is the number of ore types
- [math]\displaystyle{ d_i }[/math] is the size of the square mesh interval that mass is retained on (mm)
- [math]\displaystyle{ d_{i+1}\lt d_i\lt d_{i-1} }[/math], i.e. descending size order from top size ([math]\displaystyle{ d_{1} }[/math]) to sub mesh ([math]\displaystyle{ d_{p}=0 }[/math] mm)
- [math]\displaystyle{ \rho_{\rm S} }[/math] is the density of solids (t/m3)
Results
The results are displayed in Excel as an array corresponding to the matrix notation below:
- [math]\displaystyle{ \mathit{mdUnit\_AirClassifier\_Altun} = \begin{bmatrix} \begin{bmatrix} \mathit{DL}\text{ (kg/m}^3\text{)}\\ F\text{ (t/h)}\\ \alpha\\ d_{\rm 50c}\text{ (mm)}\\ C\text{ (frac)}\\ \beta\\ \beta^*\\ (Q_{\rm M,OF})_{\rm L}\text{ (t/h)}\\ (Q_{\rm M,UF})_{\rm L}\text{ (t/h)}\\ \end{bmatrix} \begin{array}{cccccc} \begin{bmatrix} \bar d_1\text{ (mm)}\\ \vdots\\ \bar d_n\text{ (mm)} \end{bmatrix} & \begin{bmatrix} (Q_{\rm M,UF})_{11}\text{ (t/h)} & \dots & (Q_{\rm M,UF})_{1m}\text{ (t/h)}\\ \vdots & \ddots & \vdots\\ (Q_{\rm M,UF})_{n1}\text{ (t/h)} & \dots & (Q_{\rm M,UF})_{nm}\text{ (t/h)}\\ \end{bmatrix} & \begin{bmatrix} (Q_{\rm M,OF})_{11}\text{ (t/h)} & \dots & (Q_{\rm M,OF})_{1m}\text{ (t/h)}\\ \vdots & \ddots & \vdots\\ (Q_{\rm M,OF})_{n1}\text{ (t/h)} & \dots & (Q_{\rm M,OF})_{nm}\text{ (t/h)}\\ \end{bmatrix} & \begin{bmatrix} (P_{\rm OF})_1\text{ (frac)}\\ \vdots\\ (P_{\rm OF})_n\text{ (frac)} \end{bmatrix} \\ \\ \\ \\ \\ \\ \\ \end{array} \end{bmatrix} }[/math]
where:
- [math]\displaystyle{ \mathit{DL} }[/math] is the dust loading (kg/m3)
- [math]\displaystyle{ F }[/math] is the flow rate of -36+3 µm size particles in the feed (t/h)
- [math]\displaystyle{ \alpha }[/math] is the sharpness parameter of the Whiten-Beta efficiency curve
- [math]\displaystyle{ d_{\rm 50c} }[/math] is the cut size parameter of the Whiten-Beta efficiency curve (mm)
- [math]\displaystyle{ C }[/math] is the bypass parameter of the Whiten-Beta efficiency curve (frac)
- [math]\displaystyle{ \beta }[/math] is a fish-hook parameter of the Whiten-Beta efficiency curve
- [math]\displaystyle{ \beta^* }[/math] is a fish-hook parameter of the Whiten-Beta efficiency curve
- [math]\displaystyle{ (Q_{\rm M,OF})_{\rm L} }[/math] is the mass flow rate of liquids to the overflow stream (t/h)
- [math]\displaystyle{ (Q_{\rm M,UF})_{\rm L} }[/math] is the mass flow rate of liquids to the underflow stream (t/h)
- [math]\displaystyle{ P_{\rm OF} }[/math] is the partition fraction to overflow (frac)
Example
The images below show the selection of input arrays and output results in the Excel interface.
SysCAD
References
- ↑ Altun, O. and Benzer, H., 2014. Selection and mathematical modelling of high efficiency air classifiers. Powder Technology, 264, pp.1-8.


