Tumbling Mill (Power, Morrell Discrete Shell)

From Met Dynamics
Jump to navigation Jump to search

Description

This article describes the Morrell Discrete Shell (Morrell D) method for estimating the power draw of a tumbling mill.[1] The Morrel D model adopts a more sophisticated treatment of charge dynamics than the Morrell Continuum method:

  • The total charge is subdivided into discrete layers, or shells, whose size and position may individually vary due to grinding media size, mill speed, lift bar geometry and other conditions.
  • The rate at which potential and kinetic energy is imparted to each shell during mill rotation is calculated separately and subsequently summed to estimate the total mill power draw.

Model theory

Figure 1. Grate discharge tumbling mill profile illustrating the Morrell D model's charge shape and concentric shell layers (at increments of five for clarity).

The radial position (), shoulder position () and toe position () of shell 25 are shown as an example.
Figure 2. Schematic of a tumbling mill showing key dimensions.

This section summarises the main relations comprising Morrell's Discrete Shell tumbling mill power model. For a full description of the model algorithms, the reader is referred to Morrell's publicly available dissertation.

Following the observation that ball and rock size has an effect on tumbling mill power draw, Morrell improved the Continuum model approach by treating the charge as a collection of individual rocks and balls, rather than a continuous phase.

This was achieved by considering the charge as a number of layered, concentric annular sectors, or shells, as shown in Figure 1. These shells slide against one another during mill rotation, leading to an increasing loss of rotational rate of between the layers due to slip as their distance from the outer mill shell increases.

The power imparted to each shell is therefore different, and the total power input to the motor of a tumbling mill is then:

where is the power draw of discrete shell , and is the number of shells comprising the charge.

Power per shell

The power draw of an individual shell in the cylindrical section of the mill due to the potential energy of the charge, the kinetic energy of the charge and the potential energy of the slurry pool is:

where:

  • is the radial distance of the shell from the centre of rotation (m)
  • is the thickness of the shell (m)
  • is the rotational rate at radial position (revs/s)
  • is the mill length of cylindrical section (m)
  • is the charge density (t/m3)
  • is the discharge pulp density (t/m3)
  • is the shoulder angle at radial position (rad)
  • is the toe angle at radial position (rad)
  • is the slurry pool overflow angle (rad)
  • is acceleration due to gravity (m/s2)

and all angles are unit circle positive.

Shell rotational rate

Shells are assumed to slip against one another and progressively lose rotational speed as the radial position moves from the top of the lifters towards the centre of rotation.

The loss of rotational speed of a discrete shell, , at radial position is:

where is the radius of the inner surface of the shell, i.e. , and is a slip parameter which is expected to be related to the coefficient of friction.

The parameter is an empirical term that relates the rotational rate of particles at radial positions within the charge to the rotational rate of the mill, and is defined as:

where is the volume fraction mill filling at radial position , i.e. the fraction of the total volume between the mill centre and shell radius that is filled with charge.

Shells located between the top of the lifters and outer mill shell are locked into place by the lifters, and rotate at the mill rotational speed without loss.

Characteristic media size

The thickness of each shell, , is related to the particle size distribution of the charge (balls and coarse rocks). Morrell adopted the concept of a characteristic media size to determine a representative layer thickness.

The characteristic media size is the number-weighted mean diameter of all particles from the coarsest in the charge to the largest that can fit within the grinding media interstices, the media size lower limit. Therefore:

where is the number of particles in size interval , for , with being the coarsest fraction and being the size fraction whose geometric mean size is the media size lower limit.

The number of particles in each size interval, , is computed as:

where is the total mass of particles in size interval , is the density of particles, and is the geometric mean size of size interval .

The media size lower limit was established from measurement of the charge in a laboratory mill, in rough agreement with a theoretical analysis, and is defined as:

where:

  • is the geometric mean size of the coarsest size fraction in the mill, e.g. make-up ball diameter
  • is the 95% percent passing size (P95) of particles (balls or rocks) in the mill (or feed)

Calculation of the characteristic media size requires the full particle size distribution of balls and ore in the mill.

For ball mills, the characteristic media size may be estimated by neglecting ore particles and assuming the ball size size distribution is in an equilibrium state (ball make-up rate = ball ejection rate), in which case:

where is the make-up ball diameter.

Note that Morrell's ball size equilibrium assumptions are also consistent with the tumbling mill media string approach described here.

Charge position

Morrell developed the following series of relations to estimate the geometry of a shell at radial position .

Toe and shoulder positions

The position of the toe of a shell, (rad), is defined as:

where (frac) is the theoretical fraction critical speed, and the fraction of critical speed at which centrifuging actually occurs, (frac), is:

The position of the shoulder of a shell, (rad), is:

This implementation of the Discrete Shell model further adopts the Delboni (2002) approach for shells at radial positions between the mill outer shell and the top of installed lifters.[2]

The toe and shoulder positions of these outer shells are determined by applying Powell's (1991) method for computing the trajectory of grinding media elements in a tumbling mill.[3]

The shoulder position of such shells is the point of departure of a media element of size from the tip of a lifter into free flight, from a starting position determined by the shell radial position, . Similarly, the shell toe position is the point of impact with the outer mill shell of the same grinding media element in free flight .

The remaining shells at radial distances above the height of the lifters use Morrell's original shoulder and toe position relations described above.

Slurry pool position

The position of the slurry pool level, (rad), was assumed to be equal to the charge toe, , for grate mills. For overflow mills, a value of 3.395 radians was calculated where the trunnion radius, , is one quarter (0.25) of the mill radius, .

This implementation of the Discrete Shell model improves estimation of the slurry pool position for overflow mills by adopting the approach described by Morrell (2016) and corrected by Shi (2016):[4][5]

where is the height of slurry flow above the level of the trunnion lip:

and is the volumetric flow rate of pulp to/from the overflow mill.

Shell volume

The shell shoulder and toe positions only account for the active portion of the charge, i.e. the fraction not in free-flight between the should and the toe. The total volume of a shell, including the inactive portion, must be computed by the model algorithm to ensure the sum of all shell volumes equals the total charge volume. The total shell volume is therefore:

where is the fraction of total shell volume in the active portion. is estimated as:

where is the time taken to travel between the toe and shoulder at radial position within the active portion of the shell, and is the time taken to travel in free flight between the shoulder and toe at radial position . i.e.,

Charge density

Morrell's 1993 Discrete Shell model algorithm assumed the grinding media interstices were completely filled with slurry.

This implementation adopts Morrell's 1996 approach to compute charge density, which includes a term for the fraction of void space occupied by slurry:[6]

where:

  • is the volumetric fraction of the mill occupied by balls and coarse rock (including void space and interstitial slurry) (v/v).
  • is the density of ore (t/m3)
  • is volumetric fraction of interstitial void space in the charge, typically 0.4 (v/v)
  • is the volumetric fraction of interstitial grinding media voidage occupied by slurry (v/v),
  • is the volume fraction of solids in the mill discharge (v/v)
  • is the volumetric fraction of the mill occupied by balls (including voids) (v/v)

Conical ends

Figure 3. Discretisation of cone end shells, Morrell Discrete Shell tumbling mill power model (after Morrell, 1993).[1]

The power draw of the cone end sections of the mill is approximated by further sub-dividing the discrete shells into vertical slices along the mill length dimension, as illustrated in Figure 3.

The outer radial positions of the vertical slices are set to be consistent with the cone geometry. The shell thickness, , is also used as the slice width in the mill length direction.

Power in the cone slices is subsequently calculated using the same approach as the shells in the cylindrical section of the mill.

No-load power

This implementation of the Discrete Shell model uses Morrell's 1996 term for no-load power:[6]

where is mill diameter inside liners (m) and is length of the cone end (m).

The length of the cone end, (m), is:

where is the cone angle, measured as the angular displacement of the cone surface from the vertical direction.

Model algorithm

The Morrell D model adopts the algorithm outlined below to compute total mill power draw:

  1. The charge is divided into a number of shells based on the total charge volume, , the user-defined characteristic media size, , and an estimate of the charge inner surface radius,
  2. The radial position, rotational speed, power draw and volume of each individual shell is then computed using the relations described in the previous sections.
  3. The charge inner surface radius, and hence the number of shells, is re-estimated and the calculation steps 1 - 3 repeated until the sum of shell volumes matches the total charge volume.
  4. An inner loop around steps 1 - 2 also makes incremental adjustments to the characteristic media size value, , to minimise the numerical error associated with discretising the real number-valued charge volume into an integer number of shells with variable volume.
  5. Net power draw is calculated by summing the shell power values.
  6. The net power calculation process in steps 1 - 5 is conducted twice; once with the laboratory-observed slip parameter () value of 0.02433, and then again with the industrial mill value of 0.0028 (or a user-specified value). This estimates the fractions of net power draw attributable to to attrition/abrasion (industrial mill only) and impact mechanisms (industrial and laboratory mills).
  7. Total power draw is finally calculated by adding the net power and no-load power values.

Additional notes

The Morrell D model requires an estimation of the charge particle size distribution (balls and coarse ore), and lifter geometry, both of which are typically not available during normal mill operation. In addition, the model applies a a multi-step, looping computational algorithm which makes it unsuited to spreadsheet-style calculations. For these reasons, the Morrell D model has not been tested and applied as extensively as the Morrell Continuum and Empirical models.

Nevertheless, the Morrell D model may find utility when coupled with process models that predict mill load and ball particle size distributions (e.g. AG/SAG Mill (Variable Rates) and Tumbling Mill (Media Strings)), and lifter wear measurements from modern laser scanning devices.

Like the Continuum and Empirical models, the Morrell D model is only valid for grate discharge mills that do not exhibit a slurry pool, i.e. . The slurry pool present in overflow discharge mills is included within the model formulation via the term, as described above.

Excel

The Morrell Discrete Shell mill power model may be invoked from the Excel formula bar with the following function call:

=mdMillPower_MorrellD(Parameters as Range)

Invoking the function with no arguments will print Help text associated with the model, including a link to this page.

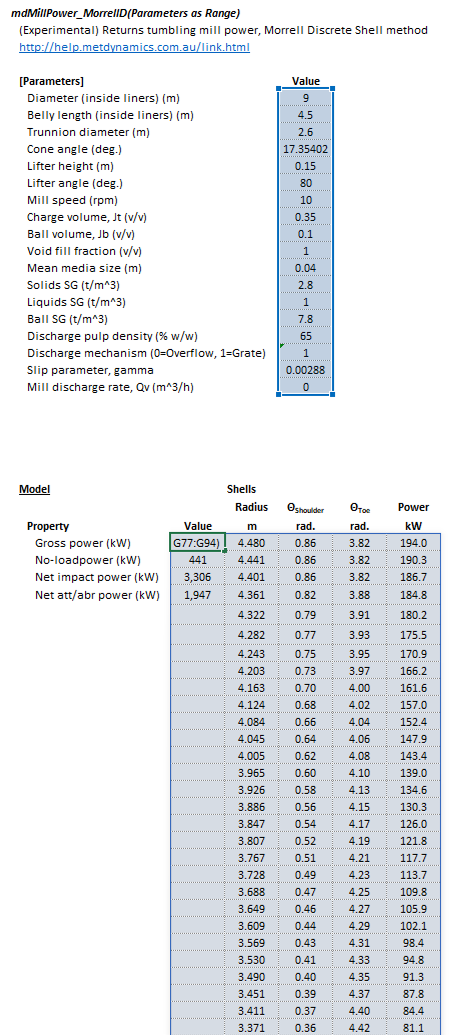
The Parameters array and model results are defined below in matrix notation, along with an example image showing the selection of the same arrays in the Excel interface:


where:

  • is the diameter of the discharge trunnion (m), i.e.
  • is the lifter height (m)
  • is the lifter face angle (deg.)
  • is the rotational speed of the mill (rpm)
  • is the density of liquids (t/m3)
  • is the mass fraction of solids in the discharge pulp (% w/w)
  • is the discharge configuration type, 0 = Grate, 1 = Overflow
  • is the volumetric discharge flow rate of pulp from the mill (m3/h)
  • is the power draw attributable to the impact mechanism (kW)
  • is the power draw attributable to the attrition/abrasion mechanisms (kW)
  • is the number of discrete shells
  • is the radius of shell (m)
  • is the angular position of the shoulder of shell (rad)
  • is the angular position of the toe of shell (rad)
  • is the power drawn by shell (kW)
Figure 4. Example showing the selection of the Parameters (blue frame), and Results (light blue frame) arrays in Excel.

SysCAD

The Morrell Discrete Shell power model is an optional calculation for tumbling mill units. If selected, the input and display parameters below are shown.

Tag (Long/Short) Input / Display Description/Calculated Variables/Options
MorrellC
HelpLink ButtonModelHelp.png Opens a link to this page using the system default web browser. Note: Internet access is required.
MillDiameter Input/Display Diameter of the mill (inside liners).
BellyLength Input/Display Length of the cylindrical section (belly) of the mill (inside liners).
TrunnionDiameter Input/Display Diameter of the trunnion (inside liners).
ConeAngle Input/Display Angular displacement of the cone surface from the vertical direction.
LifterHeight Input Height of the lifters above the liner surface
LifterAngle Input Angle between the face and the base of the lifter
MillRPM Input/Display Mill rotational speed
Jt Input/Display Volumetric fraction of the mill occupied by balls and coarse rock (including voids).
BallLoadVol Input/Display Volumetric fraction of the mill occupied by balls (including voids).
VoidFillFraction Input/Display Volumetric fraction of interstitial grinding media voidage occupied by slurry.
MeanMediaSize Input Characteristic media size,
SolidsSG Display Specific Gravity or density of solids.
LiquidsSG Display Specific Gravity or density of liquids.
BallSG Input/Display Specific Gravity or density of balls.
Cw Display Mass fraction of solids in discharge slurry.
DischargeType Grate/Overflow Discharge configuration, grate or overflow.
Gamma Input Value of the slip coefficient,
ThetaShoulder Display Angle of the shoulder of the outermost charge shell.
ThetaToe Display Angle of the toe of the outermost charge toe
NoLoadPower Display Power input to the motor when the mill is empty (no balls, rocks or slurry).
NetImpactPower Display Net power attributable to impact
NetAttAbrPower Display Net power attributable to attrition/abrasion
NetPower Display Charge motion power.
GrossPower Display Power input to the motor.

See also

References

  1. 1.0 1.1 Morrell, S., 1993. The prediction of power draw in wet tumbling mills (Doctoral dissertation, University of Queensland).
  2. Delboni Jr, H. and Morrell, S., 2002. A load-interactive model for predicting the performance of autogenous and semi-autogenous mills. KONA Powder and Particle Journal, 20, pp.208-222.
  3. Powell, M.S., 1991. The effect of liner design on the motion of the outer grinding elements in a rotary mill. International Journal of Mineral Processing, 31(3-4), pp.163-193.
  4. Morrell, S., 2016. Modelling the influence on power draw of the slurry phase in Autogenous (AG), Semi-autogenous (SAG) and ball mills. Minerals Engineering, 89, pp.148-156.
  5. Shi, F., 2016. An overfilling indicator for wet overflow ball mills. Minerals Engineering, 95, pp.146-154.
  6. 6.0 6.1 Morrell, S., 1996. Power draw of wet tumbling mills and its relationship to charge dynamics. Pt. 1: a continuum approach to mathematical modelling of mill power draw. Transactions of the Institution of Mining and Metallurgy. Section C. Mineral Processing and Extractive Metallurgy, 105.