Flotation Cell (Savassi)
Description
This article describes a model that estimates the recovery of ore and gangue from a mechanical flotation cell.
The approach is outlined by Savassi (2005), who proposed a compartment model that separates the mechanisms of true flotation, froth recovery, and entrainment.[1]
Savassi's original model was further extended over many years by subsequent researchers, and the resulting methodology is frequently referred to as the "P9 model" in reference to the AMIRA P9 project that has driven much of the development since.[2]
The model described here is for steady-state simulation. For dynamic simulation, see Flotation Cell (Savassi, Dynamic).
Model theory
Floatability classes
Recovery
Pulp volume
Gas hold-up
Residence time
Bubble surface area flux
Froth recovery
Entrainment
No entrainment
Water recovery
Water rate function
Excel
The Savassi flotation cell model may be invoked from the Excel formula bar with the following function call:
=mdUnit_Flotation_Savassi(Parameters as Range, Size as Range, Feed as Range, OreSG As Range, Floatability as Range, Optional CellScaleUp As Range = Nothing, Optional FrothRecovery as Range = Nothing, Optional Entrainment as Range = Nothing, Optional DetachRateConst as Range = Nothing, Optional DrainageFactor as Range = Nothing)
Several of the function input parameters are marked as Optional:
- If CellScaleUp is omitted, cell scale up ignored and [math]\displaystyle{ C_{ij}=1 }[/math] for all [math]\displaystyle{ i }[/math] and [math]\displaystyle{ j }[/math]
- If FrothRecovery is omitted, froth recovery is ignored and [math]\displaystyle{ Rf_{ij}=1 }[/math] for all [math]\displaystyle{ i }[/math] and [math]\displaystyle{ j }[/math]
- If Entrainment is omitted, recovery by entrainment is ignored and [math]\displaystyle{ {\rm ENT}_{ij}=0 }[/math] for all [math]\displaystyle{ i }[/math] and [math]\displaystyle{ j }[/math]
- If DetachRateConst is omitted, [math]\displaystyle{ \beta_{j}=0 }[/math] for all [math]\displaystyle{ j }[/math]
- If DrainageFactor is omitted, [math]\displaystyle{ \omega_{i}=0 }[/math] for all [math]\displaystyle{ i }[/math]
Invoking the function with no arguments will print Help text associated with the model, including a link to this page.
Inputs
The required inputs are defined below in matrix notation with elements corresponding to cells in Excel row ([math]\displaystyle{ i }[/math]) x column ([math]\displaystyle{ j }[/math]) format:
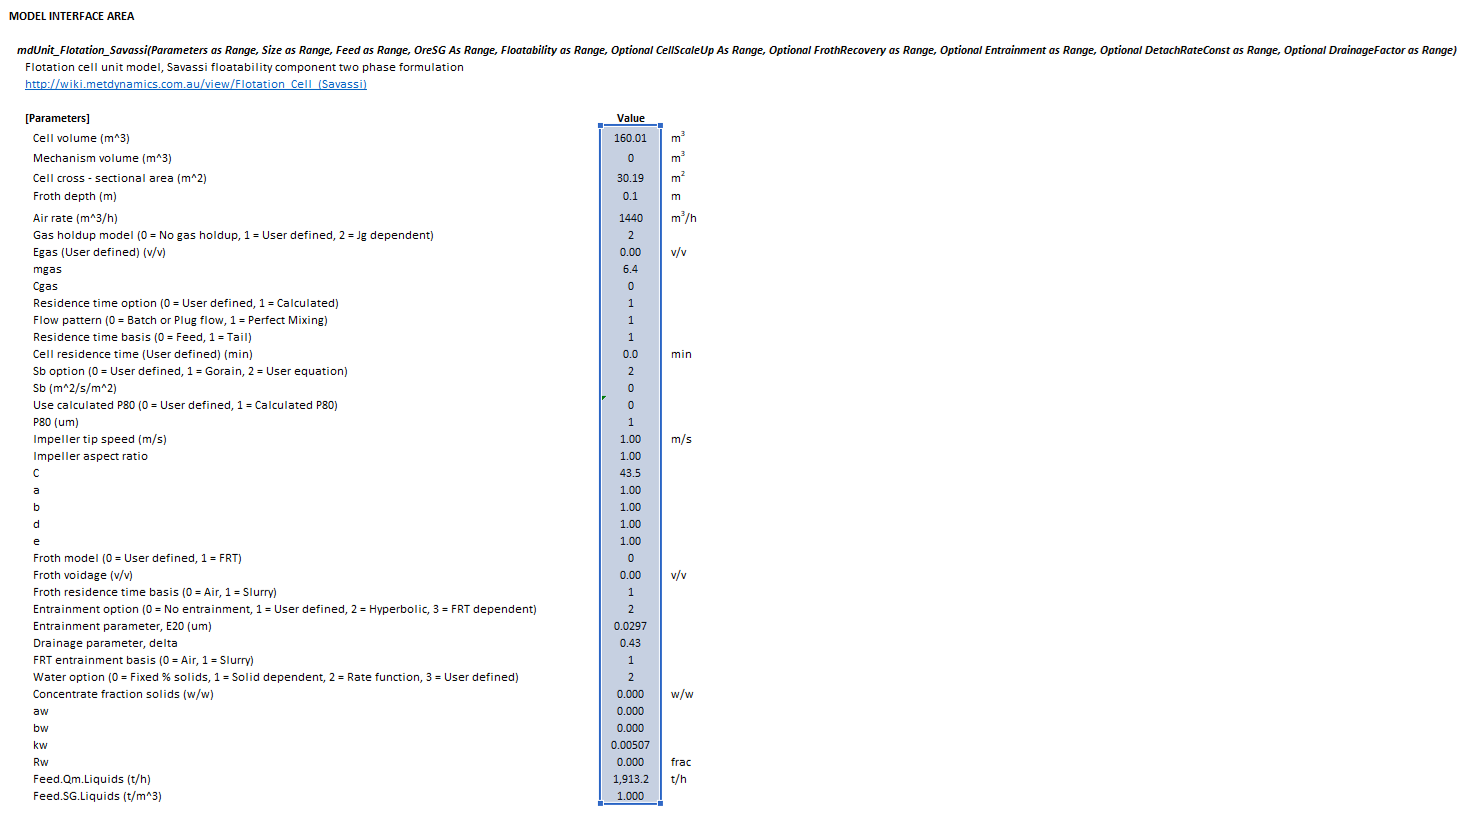
- [math]\displaystyle{ Parameters= \begin{bmatrix} V_{\rm cell}\text{ (m}^\text{3)}\\ V_{\rm mechanism}\text{ (m}^\text{3)}\\ A_{\rm cell}\text{ (m}^\text{2)}\\ H_{\rm f}\text{ (m)}\\ Q_{\rm air}\text{ (m}^\text{3}\text{/h)}\\ \text{Gas holdup model}\\ \varepsilon_{\rm gas}\text{ (v/v)}\\ m_{\rm gas}\\ C_{\rm gas}\\ \text{Residence time option}\\ \text{Flow pattern}\\ \text{Residence time basis}\\ \tau\text{ (min)}\\ \text{Sb option}\\ S_{\rm b}\text{ (m}^2\text{/s/m}^2\text{)}\\ \text{Use calculated P80}\\ P_{80}\text{ (}\mu\text{m)}\\ N_{\rm s}\text{ (m/s)}\\ A_{\rm s}\text{ (m/m)}\\ C_{\rm Sb}\\ a\\ b\\ d\\ e\\ \text{Froth model}\\ \text{Froth residence time basis}\\ \varepsilon_{\rm froth}\text{ (v/v)}\\ \text{Entrainment option}\\ E20\text{ (}\mu\text{m)}\\ \delta\\ \text{FRT entrainment basis}\\ \text{Water option}\\ \text{Concentrate fraction solids (w/w)}\\ a_{\rm w}\\ b_{\rm w}\\ k_{\rm w}\\ R_{\rm w}\text{ (frac)}\\ (Q_{\rm M,F})_{\rm L}\text{ (t/h)}\\ \rho_{\rm L}\text{ (t/m}^\text{3}\text{)}\\ \end{bmatrix},\;\;\;\;\;\; Size = \begin{bmatrix} d_{1}\text{ (mm)}\\ \vdots\\ d_n\text{ (mm)}\\ \end{bmatrix},\;\;\;\;\;\; Feed= \begin{bmatrix} (Q_{\rm M,F})_{11}\text{ (t/h)} & \dots & (Q_{\rm M,F})_{1m}\text{ (t/h)}\\ \vdots & \ddots & \vdots\\ (Q_{\rm M,F})_{n1}\text{ (t/h)} & \dots & (Q_{\rm M,F})_{nm}\text{ (t/h)}\\ \end{bmatrix},\;\;\;\;\;\; OreSG= \begin{bmatrix} (\rho_{\rm S})_{1}\text{ (t/m}^\text{3}\text{)} & \dots & (\rho_{\rm S})_m\text{ (t/m}^\text{3}\text{)}\\ \end{bmatrix} }[/math]
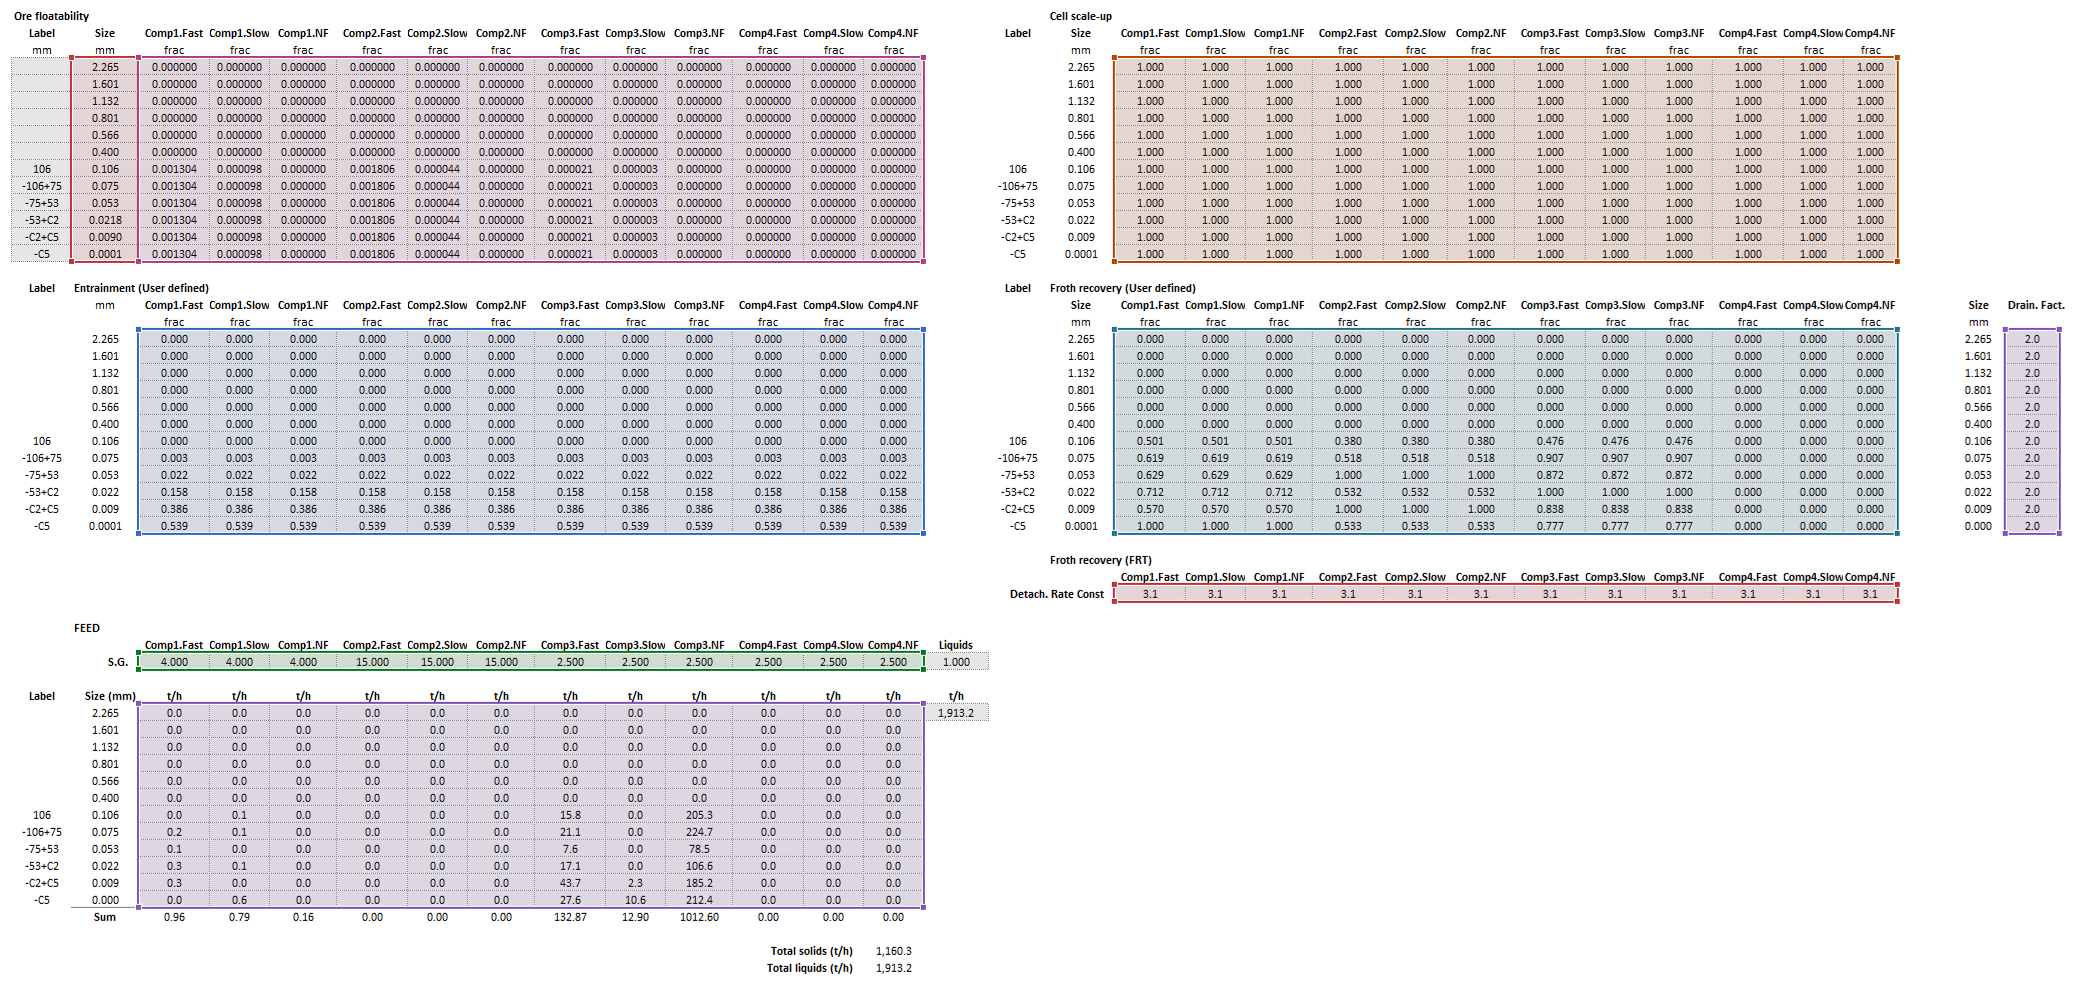
- [math]\displaystyle{ Floatability = \begin{bmatrix} P_{11}\text{ (frac)} & \dots & P_{1m}\text{ (frac)}\\ \vdots & \ddots & \vdots\\ P_{n1}\text{ (frac)} & \dots & P_{nm}\text{ (frac)}\\ \end{bmatrix},\;\;\;\;\;\; CellScaleUp= \begin{bmatrix} C_{11} & \dots & C_{1m}\\ \vdots & \ddots & \vdots\\ C_{n1} & \dots & C_{nm}\\ \end{bmatrix},\;\;\;\;\;\; FrothRecovery = \begin{bmatrix} Rf_{11}\text{ (frac)} & \dots & Rf_{1m}\text{ (frac)}\\ \vdots & \ddots & \vdots\\ Rf_{n1}\text{ (frac)} & \dots & Rf_{nm}\text{ (frac)}\\ \end{bmatrix},\;\;\;\;\;\; }[/math]
- [math]\displaystyle{ Entrainment = \begin{bmatrix} {\rm ENT}_{11}\text{ (frac)} & \dots & {\rm ENT}_{1m}\text{ (frac)}\\ \vdots & \ddots & \vdots\\ {\rm ENT}_{n1}\text{ (frac)} & \dots & {\rm ENT}_{nm}\text{ (frac)}\\ \end{bmatrix},\;\;\;\;\;\; DetachRateConst = \begin{bmatrix} \beta_{1}\text{ (min}^{\text{-1}}\text{)} & \cdots & \beta_m\text{ (min}^{\text{-1}}\text{)}\\ \end{bmatrix} \quad \text{or} \quad \begin{bmatrix} \beta_{1}\text{ (min}^{\text{-1}}\text{)} & \cdots & \beta_m\text{ (min}^{\text{-1}}\text{)}\\ (\eta_p)_{1}\text{ (min}^{\text{-1}}\text{)} & \cdots & (\eta_p)_m\text{ (min}^{\text{-1}}\text{)}\\ \end{bmatrix}, }[/math]
- [math]\displaystyle{ DrainageFactor = \begin{bmatrix} \omega_{1}\text{ (min}^{\text{-1}}\text{)}\\ \vdots\\ \omega_n\text{ (min}^{\text{-1}}\text{)}\\ \end{bmatrix} }[/math]
where:
- [math]\displaystyle{ \text{Gas holdup model} }[/math] specifies the method used to determine the gas-hold up, 0 = No gas holdup, 1 = User defined, 2 = Jg dependent
- [math]\displaystyle{ \varepsilon_{\rm gas} }[/math] is the user-defined value of gas hold-up (v/v) if [math]\displaystyle{ \text{Gas holdup model} = 1 }[/math], ignored otherwise
- [math]\displaystyle{ m_{\rm gas} }[/math] is the value of the slope coefficient if [math]\displaystyle{ \text{Gas holdup model} = 2 }[/math], ignored otherwise
- [math]\displaystyle{ C_{\rm gas} }[/math] is the value of the slope coefficient if [math]\displaystyle{ \text{Gas holdup model} = 2 }[/math], ignored otherwise
- [math]\displaystyle{ \text{Residence time option} }[/math] specifies the method used to determine the residence time, 0 = User defined, 1 = Calculated
- [math]\displaystyle{ \text{Flow pattern} }[/math] specifies the cell flow configuration, 0 = Batch or Plug flow, 1 = Perfect Mixing (Continuous)
- [math]\displaystyle{ \text{Residence time basis} }[/math] specifies the stream which is used to computed the residence time, 0 = Feed, 1 = Tail
- [math]\displaystyle{ \text{Sb option} }[/math] specifies the method used to determine the bubble surface area, 0 = User defined, 1 = Gorain, 2 = User equation
- [math]\displaystyle{ S_{\rm b} }[/math] is the user-defined value of bubble surface area flux (m2/s/m2) if [math]\displaystyle{ \text{Sb option} = 0 }[/math], ignored otherwise
- [math]\displaystyle{ \text{Use calculated P80} }[/math] indicates whether the [math]\displaystyle{ P_{80} }[/math] for the Gorain equation ([math]\displaystyle{ \text{Sb option} = 1,2 }[/math]) is user-defined or determined from the feed stream , 0 = User defined, 1 = Calculated P80
- [math]\displaystyle{ P_{80} }[/math] is the user-defined value of [math]\displaystyle{ P_{80} }[/math] (μm) if [math]\displaystyle{ \text{Sb option} = 1,2 }[/math] and [math]\displaystyle{ \text{Use calculated P80} = 1 }[/math], ignored otherwise
- [math]\displaystyle{ N_{\rm s} }[/math] is the user-defined value of impeller speed (m/s) if [math]\displaystyle{ \text{Sb option} = 1,2 }[/math], ignored otherwise
- [math]\displaystyle{ A_{\rm s} }[/math] is the user-defined value of impeller aspect ratio (m/m) if [math]\displaystyle{ \text{Sb option} = 1,2 }[/math], ignored otherwise
- [math]\displaystyle{ C_{\rm Sb} }[/math] is a user-defined coefficient of the Gorain relation if [math]\displaystyle{ \text{Sb option} = 2 }[/math], ignored otherwise
- [math]\displaystyle{ a \dots d }[/math] are user-defined exponents of the Gorain relation if [math]\displaystyle{ \text{Sb option} = 2 }[/math], ignored otherwise
- [math]\displaystyle{ \text{Froth model} }[/math] specifies the method used to determine froth recovery, 0 = User defined, 1 = FRT Entrain, 2 = FRT User Np
- [math]\displaystyle{ \text{Froth residence time basis} }[/math] specifies the phase which is used to computed the froth residence time, 0 = Air, 1 = Slurry, if [math]\displaystyle{ \text{Froth model} = 1 }[/math], ignored otherwise
- [math]\displaystyle{ \varepsilon_{\rm froth} }[/math] is the value of the gas hold up fraction (v/v) if [math]\displaystyle{ \text{Froth model} = 1 }[/math], ignored otherwise
- [math]\displaystyle{ \text{Entrainment option} }[/math] specifies the method used to determine entrainment, 0 = No entrainment, 1 = User defined, 2 = Hyperbolic, 3 = FRT dependent
- [math]\displaystyle{ E20 }[/math] is the value of the hyperbolic equation particle size term (μm) if [math]\displaystyle{ \text{Entrainment option} = 2 }[/math], ignored otherwise
- [math]\displaystyle{ \delta }[/math] is the value of the hyperbolic equation drainage factor (-) if [math]\displaystyle{ \text{Entrainment option} = 2 }[/math], ignored otherwise
- [math]\displaystyle{ \text{FRT entrainment basis} }[/math] specifies the phase which is used to computed the froth residence time for entrainment, 0 = Air, 1 = Slurry, if [math]\displaystyle{ \text{Entrainment option} = 3 }[/math], ignored otherwise
- [math]\displaystyle{ \text{Water option} }[/math] specifies the method used to determine water recovery, 0 = Fixed % solids, 1 = Solid dependent, 2 = rate function, 3 = User defined
- [math]\displaystyle{ \text{Concentrate fraction solids} }[/math] is the user-defined value of concentrate pulp density (w/w) if [math]\displaystyle{ \text{Water option} = 0 }[/math], ignored otherwise
- [math]\displaystyle{ a_{\rm w} }[/math] is a user-defined coefficient if [math]\displaystyle{ \text{Water option} = 1 }[/math], ignored otherwise
- [math]\displaystyle{ b_{\rm w} }[/math] is a user-defined exponent if [math]\displaystyle{ \text{Water option} = 1 }[/math], ignored otherwise
- [math]\displaystyle{ k_{\rm w} }[/math] is a user-defined kinetic rate parameter if [math]\displaystyle{ \text{Water option} = 2 }[/math], ignored otherwise
- [math]\displaystyle{ R_{\rm w} }[/math] is a user-defined water split to concentrate if [math]\displaystyle{ \text{Water option} = 3 }[/math], ignored otherwise
- [math]\displaystyle{ (Q_{\rm M,F})_{\rm L} }[/math] is the mass flow feed rate of liquids into the cell (t/h)
- [math]\displaystyle{ \rho_{\rm L} }[/math] is the Specific Gravity or density of liquids in the feed (- or t/m3)
- [math]\displaystyle{ n }[/math] is the number of size intervals
- [math]\displaystyle{ m }[/math] is the number of ore types (floatability classes)
- [math]\displaystyle{ d_i }[/math] is the size of the square mesh interval that feed mass is retained on (mm)
- [math]\displaystyle{ d_{i+1}\lt d_i\lt d_{i-1} }[/math], i.e. descending size order from top size ([math]\displaystyle{ d_{1} }[/math]) to sub mesh ([math]\displaystyle{ d_{n}=0 }[/math] mm)
- [math]\displaystyle{ Q_{\rm M,F} }[/math] is the mass flow rate of particles in the feed (t/h)
- [math]\displaystyle{ \rho_{\rm S} }[/math] is the Specific Gravity or density of solids (- or t/m3)
Results
The results are displayed in Excel as an array corresponding to the matrix notation below:
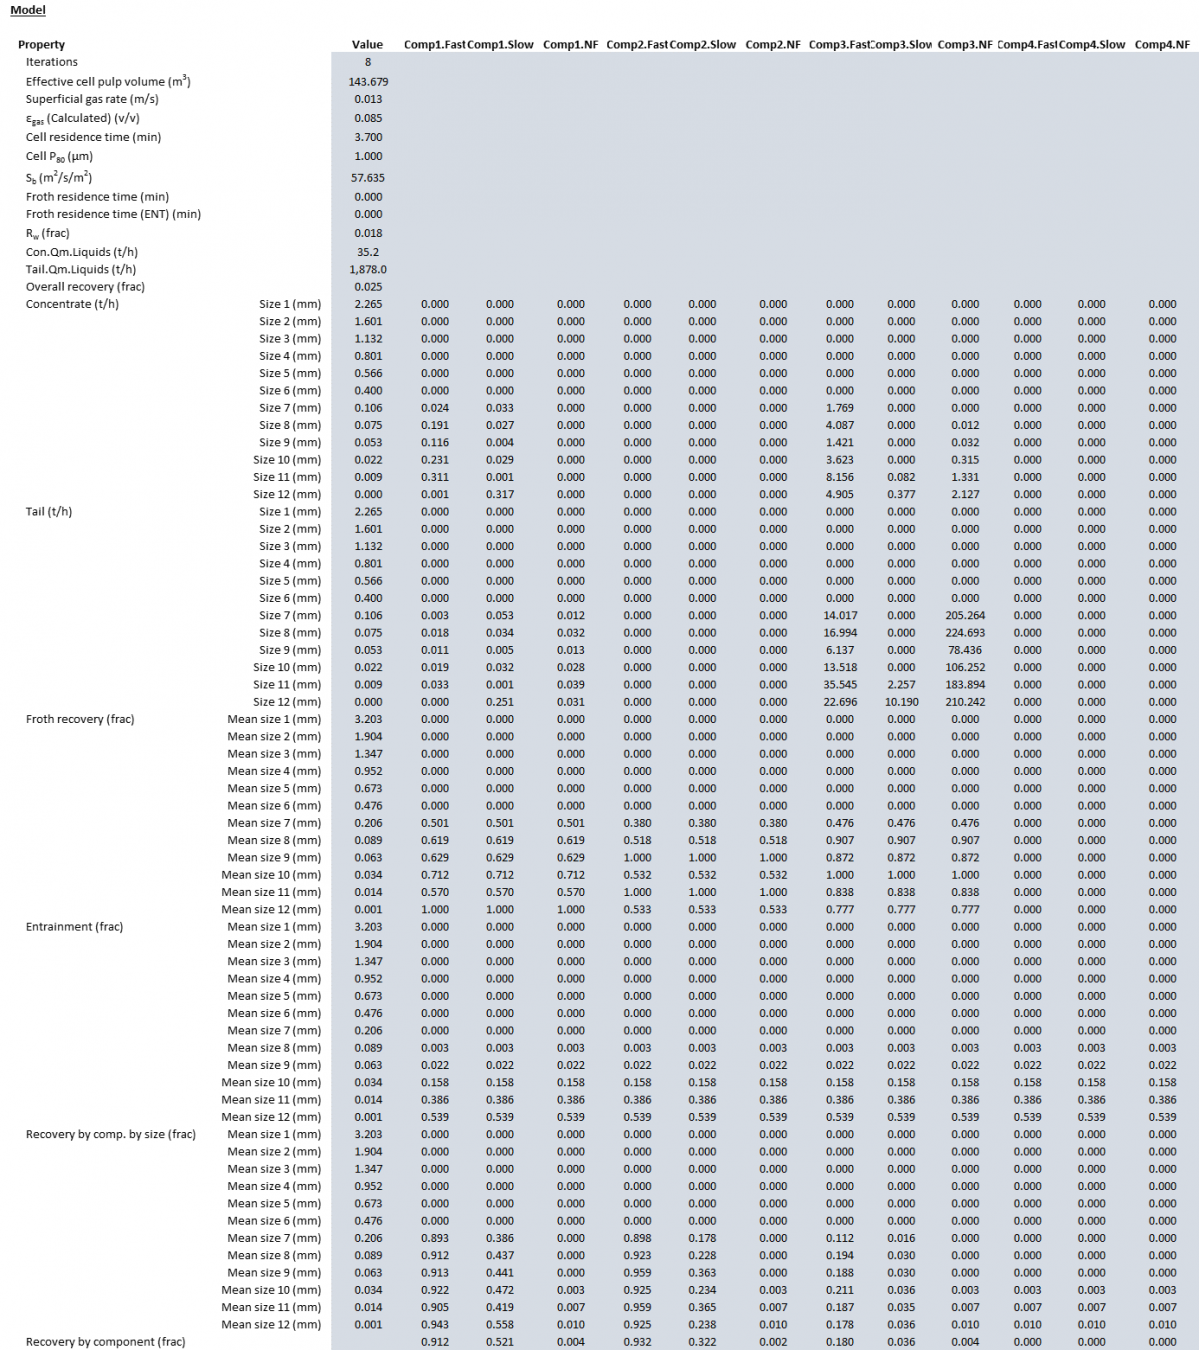
- [math]\displaystyle{ mdUnit\_Flotation\_Savassi = \begin{bmatrix} \begin{bmatrix} \text{Iterations}\\ V_{{\rm effective}}\text{ (m}^3\text{)}\\ J_{\rm g}\text{ (m/s)}\\ \varepsilon_{\rm gas}\text{ (v/v)}\\ \tau\text{ (min)}\\ P_{80}\text{ (}\mu \text{m)}\\ S_{\rm b}\text{ (m}^2\text{/s/m}^2\text{)}\\ {\rm FRT}\text{ (min)}\\ {\rm FRT}_{{\rm ENT}}\text{ (min)}\\ R_{\rm w}\text{ (frac)}\\ (Q_{\rm M,C})_{\rm L}\text{ (t/h)}\\ (Q_{\rm M,T})_{\rm L}\text{ (t/h)}\\ R\text{ (frac)}\\ \end{bmatrix} & \begin{bmatrix} - & \cdots & -\\ - & \cdots & -\\ - & \cdots & -\\ - & \cdots & -\\ - & \cdots & -\\ - & \cdots & -\\ - & \cdots & -\\ - & \cdots & -\\ - & \cdots & -\\ - & \cdots & -\\ - & \cdots & -\\ - & \cdots & -\\ - & \cdots & -\\ \end{bmatrix} \\ \begin{bmatrix} d_1\text{ (mm)}\\ \vdots\\ d_n\text{ (mm)} \end{bmatrix} & \begin{bmatrix} (Q_{\rm M,C})_{11}\text{ (t/h)} & \dots & (Q_{\rm M,C})_{1m}\text{ (t/h)}\\ \vdots & \ddots & \vdots\\ (Q_{\rm M,C})_{n1}\text{ (t/h)} & \dots & (Q_{\rm M,C})_{nm}\text{ (t/h)}\\ \end{bmatrix} \\ \begin{bmatrix} d_1\text{ (mm)}\\ \vdots\\ d_n\text{ (mm)} \end{bmatrix} & \begin{bmatrix} (Q_{\rm M,T})_{11}\text{ (t/h)} & \dots & (Q_{\rm M,T})_{1m}\text{ (t/h)}\\ \vdots & \ddots & \vdots\\ (Q_{\rm M,T})_{n1}\text{ (t/h)} & \dots & (Q_{\rm M,T})_{nm}\text{ (t/h)}\\ \end{bmatrix} \\ \begin{bmatrix} \bar d_1\text{ (mm)}\\ \vdots\\ \bar d_n\text{ (mm)} \end{bmatrix} & \begin{bmatrix} Rf_{11}\text{ (frac)} & \dots & Rf_{1m}\text{ (frac)}\\ \vdots & \ddots & \vdots\\ Rf_{n1}\text{ (frac)} & \dots & Rf_{nm}\text{ (frac)}\\ \end{bmatrix} \\ \begin{bmatrix} \bar d_1\text{ (mm)}\\ \vdots\\ \bar d_n\text{ (mm)} \end{bmatrix} & \begin{bmatrix} {\rm ENT}_{11}\text{ (frac)} & \dots & {\rm ENT}_{1m}\text{ (frac)}\\ \vdots & \ddots & \vdots\\ {\rm ENT}_{n1}\text{ (frac)} & \dots & {\rm ENT}_{nm}\text{ (frac)}\\ \end{bmatrix} \\ \begin{bmatrix} \bar d_1\text{ (mm)}\\ \vdots\\ \bar d_n\text{ (mm)} \end{bmatrix} & \begin{bmatrix} R_{11}\text{ (frac)} & \dots & R_{1m}\text{ (frac)}\\ \vdots & \ddots & \vdots\\ R_{n1}\text{ (frac)} & \dots & R_{nm}\text{ (frac)}\\ \end{bmatrix} \\ \begin{bmatrix} - \end{bmatrix} & \begin{bmatrix} R_{1}\text{ (frac)} & \dots & R_{m}\text{ (frac)} \end{bmatrix} \end{bmatrix} }[/math]
where:
- [math]\displaystyle{ \text{Iterations} }[/math] is the number of iterations required to compute the tails-based residence time
- [math]\displaystyle{ {\rm FRT}_{{\rm ENT}} }[/math] is the froth residence time (min) calculated for the entrainment method, which may be different to that calculated for froth recovery based on user air/slurry selections
- [math]\displaystyle{ (Q_{\rm M,C})_{\rm L} }[/math] is the mass flow rate of liquids in the cell concentrate (t/h)
- [math]\displaystyle{ (Q_{\rm M,T})_{\rm L} }[/math] is the mass flow rate of liquids in the cell tailing (t/h)
- [math]\displaystyle{ R }[/math] is the overall recovery of all solids mass to concentrate (frac), i.e. the mass pull, computed as [math]\displaystyle{ \textstyle \sum_{i=1}^{n}{\sum_{j=1}^{m}{R_{ij}}} }[/math]
- [math]\displaystyle{ Q_{\rm M,C} }[/math] is the mass flow rate of particles in the concentrate stream (t/h)
- [math]\displaystyle{ Q_{\rm M,T} }[/math] is the mass flow rate of particles in the tail stream (t/h)
- [math]\displaystyle{ \bar{d}_i }[/math] is the geometric mean size of the internal mesh series interval that mass is retained on (mm)
- [math]\displaystyle{ R_j }[/math] is the recovery of all solids of ore type [math]\displaystyle{ j }[/math] (frac), i.e. the unsized recovery of floatability components
Example
The images below show the selection of input arrays and output results in the Excel interface.
SysCAD
The sections and variable names used in the SysCAD interface are described in detail in the following tables.
MD_Flotation page
The first tab page in the access window will have this name.
| Tag (Long/Short) | Input / Display | Description/Calculated Variables/Options |
|---|---|---|
| Tag | Display | This name tag may be modified with the change tag option. |
| Condition | Display | OK if no errors/warnings, otherwise lists errors/warnings. |
| ConditionCount | Display | The current number of errors/warnings. If condition is OK, returns 0. |
| GeneralDescription / GenDesc | Display | This is an automatically generated description for the unit. If the user has entered text in the 'EqpDesc' field on the Info tab (see below), this will be displayed here.
If this field is blank, then SysCAD will display the unit class ID. |
| Requirements | ||
| On | CheckBox | This enables the unit. If this box is not checked, then the MassFracToCon option appears below. |
| MassFracToCon | Input | Only appears if the On field above is not checked. Specifies the fraction of feed mass that reports to the concentrate stream when the model is off. |
| Method | User defined | The recovery to concentrate for each size interval is defined by the user. Different values can be used for different solids. |
| Savassi | The Savassi model is used to determine the recovery of solids and liquids to concentrate. | |
| Options | ||
| ShowQFeed | CheckBox | QFeed and associated tab pages (eg Sp) will become visible, showing the properties of the combined feed stream. |
| ShowQCon | CheckBox | QCon and associated tab pages (eg Sp) will become visible, showing the properties of the concentrate stream. |
| ShowQTail | CheckBox | QTail and associated tab pages (eg Sp) will become visible, showing the properties of the tailings stream. |
| SizeForPassingFracCalc | Input | Size fraction for % Passing calculation. The size fraction input here will be shown in the Stream Summary section. |
| FracForPassingSizeCalc | Input | Fraction passing for Size calculation. The fraction input here will be shown in the Stream Summary section. |
| Stream Summary | ||
| MassFlow / Qm | Display | The total mass flow in each stream. |
| SolidMassFlow / SQm | Display | The Solids mass flow in each stream. |
| LiquidMassFlow / LQm | Display | The Liquid mass flow in each stream. |
| VolFlow / Qv | Display | The total Volume flow in each stream. |
| Temperature / T | Display | The Temperature of each stream. |
| Density / Rho | Display | The Density of each stream. |
| SolidFrac / Sf | Display | The Solid Fraction in each stream. |
| LiquidFrac / Lf | Display | The Liquid Fraction in each stream. |
| Passing | Display | The mass fraction passing the user-specified size (in the field SizeForPassingFracCalc) in each stream. |
| Passes | Display | The user-specified (in the field FracForPassesSizeCalc) fraction of material in each stream will pass this size fraction. |
Cell page
The Cell page is used to specify the input parameters for the flotation model.
CellScaleUp page
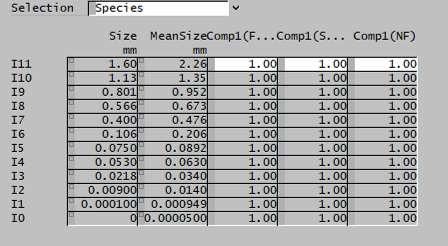
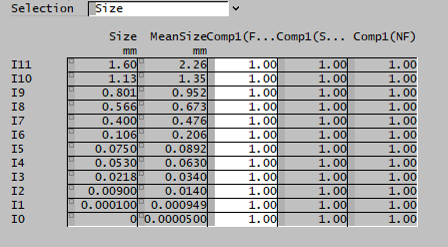
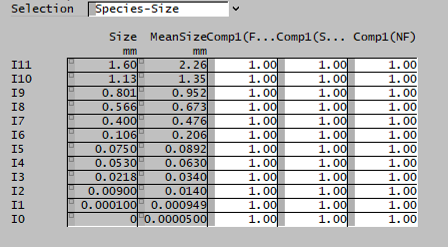
This page is used to specify the cell scale up input parameters.
| Tag (Long/Short) | Input / Display | Description/Calculated Variables/Options |
|---|---|---|
| Distribution | ||
| Name | Display | Shows the name of the SysCAD Size Distribution (PSD) quality associated with the feed stream. |
| IntervalCount | Display | Shows the number of size intervals in the SysCAD Size Distribution (PSD) quality associated with the feed stream. |
| SpWithPSDCount | Display | Shows the number of species in the feed stream assigned with the SysCAD Size Distribution (PSD) quality. |
| CellScaleUp | ||
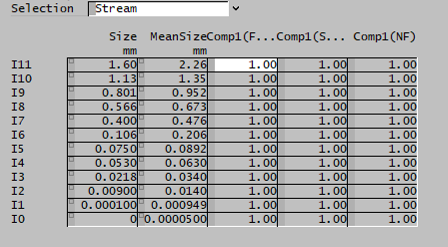
| Selection | Stream | A single CellScaleUp value is specified for all species and sizes. |
| Species | CellScaleUp values are specified per species, for all sizes of that species. | |
| Size | CellScaleUp values are specified per size interval, for all species in that interval. | |
| Species-Size | Individual CellScaleUp values are specified for each size interval of each species. | |
| Size | Display | Size of each interval in internal mesh series. |
| MeanSize | Display | Geometric mean size of each interval in internal mesh series. |
| CellScaleUp | Input / Display | Cell scale-up factor (C) for each size interval, in each solid species. |
Froth page
This page is used to specify the froth recovery input parameters.
| Tag (Long/Short) | Input / Display | Description/Calculated Variables/Options |
|---|---|---|
| Distribution | ||
| Name | Display | Shows the name of the SysCAD Size Distribution (PSD) quality associated with the feed stream. |
| IntervalCount | Display | Shows the number of size intervals in the SysCAD Size Distribution (PSD) quality associated with the feed stream. |
| SpWithPSDCount | Display | Shows the number of species in the feed stream assigned with the SysCAD Size Distribution (PSD) quality. |
| Froth | ||
| Method | User Defined | The user specifies fractional froth recovery. |
| FRT Entrain | The froth residence time model is used to determine fractional froth recovery values. The non-draining fraction is equal to calculated entrainment. | |
| FRT User Np | The froth residence time model is used to determine fractional froth recovery values. The non-draining fraction can be specified by the user. | |
| Selection | Stream | Only visible if User Defined Method is selected. A single froth recovery value is specified for all species and sizes. |
| Species | Only visible if User Defined Method is selected. Froth recovery values are specified per species, for all sizes of that species. | |
| Size | Only visible if User Defined Method is selected. Froth recovery values are specified per size interval, for all species in that interval. | |
| Species-Size | Only visible if User Defined Method is selected. Individual froth recovery values are specified for each size interval of each species. | |
| FrothVoidage / Efroth | Input | Only visible if FRT Entrain or FRT User Np methods are selected. Volumetric fraction of void space in the froth. |
| FrothResTimeBasis | Air | Only visible if FRT Entrain or FRT User Np methods are selected. Froth residence time is determined based on the superficial gas velocity (Jg). |
| Slurry | Only visible if FRT Entrain or FRT User Np methods are selected. Froth residence time is determined based on the volumetric flow rate of concentrate. | |
| FrothResidenceTime / FRT | Input / Display | Only visible if FRT Entrain or FRT User Np methods are selected. Residence time in froth. |
| DetachRateConst / Beta | Input | Only visible if FRT Entrain or FRT User Np methods are selected. Detachment rate constant per solid species. |
| NonDrainingFrac / Np | Input | Only visible if FRT Entrain or FRT User Np methods are selected. Non-draining fraction per solid species. |
| Size | Display | Size of each interval in internal mesh series. |
| MeanSize | Display | Geometric mean size of each interval in internal mesh series. |
| FrothRecovery | Input / Display | Fractional recovery in froth (Rf) for each size interval, in each solid species. |
Entrainment page
This page is used to specify the entrainment input parameters.
| Tag (Long/Short) | Input / Display | Description/Calculated Variables/Options |
|---|---|---|
| Distribution | ||
| Name | Display | Shows the name of the SysCAD Size Distribution (PSD) quality associated with the feed stream. |
| IntervalCount | Display | Shows the number of size intervals in the SysCAD Size Distribution (PSD) quality associated with the feed stream. |
| SpWithPSDCount | Display | Shows the number of species in the feed stream assigned with the SysCAD Size Distribution (PSD) quality. |
| Entrainment | ||
| Method | No Entrainment. | No entrainment, all values of ENTp are zero. |
| User Defined | The user specifies fractional recovery by entrainment. | |
| Hyperbolic | The Hyperbolic model is used to determine fractional recovery by entrainment values. | |
| FRT Dependent | The froth residence time approach is used to determine fractional recovery by entrainment values. | |
| Selection | Stream | Only visible if User Defined Method is selected. A single recovery by entrainment value is specified for all species and sizes. |
| Species | Only visible if User Defined Method is selected. Recovery by entrainment values are specified per species, for all sizes of that species. | |
| Size | Only visible if User Defined Method is selected. Recovery by entrainment values are specified per size interval, for all species in that interval. | |
| Species-Size | Only visible if User Defined Method is selected. Individual recovery by entrainment values are specified for each size interval of each species. | |
| E20 | Input | Only visible if Hyperbolic Method is selected. Parameter of the Hyperbolic entrainment equation. |
| DrainageParameter / Delta | Input | Only visible if Hyperbolic Method is selected. Parameter of the Hyperbolic entrainment equation. |
| FrothVoidage / Efroth | Input / Display | Only visible if FRT Dependent Method is selected. Volumetric fraction of void space in the froth.
Equal to the FrothVoidage input on the Froth page if the Froth Residence Time froth recovery method is selected, otherwise a user defined value. |
| FrothResTimeBasis | Air | Only visible if FRT Dependent Method is selected. Froth residence time for recovery by entrainment is determined based on the superficial gas velocity (Jg). |
| Slurry | Only visible if FRT Dependent Method is selected. Froth residence time for recovery by entrainment is determined based on the volumetric flow rate of concentrate. | |
| FrothResidenceTime / FRT | Input / Display | Only visible if FRT Dependent Method is selected. Residence time in froth for recovery by entrainment determination.
May be different to FrothResidenceTime on Froth page if different FrothResTimeBasis (Air/Slurry) is selected for each. |
| Size | Display | Size of each interval in internal mesh series. |
| MeanSize | Display | Geometric mean size of each interval in internal mesh series. |
| DrainageFactor | Input | Only visible if FRT Dependent Method is selected. Drainage factors ([math]\displaystyle{ \omega }[/math]) for the FRT entrainment equation, for each size interval. |
| Entrainment | Input / Display | Recovery by entrainment (ENTp) values for each size interval, in each solid species. |
Floatability page
This page is used to specify the floatability input parameters.
| Tag (Long/Short) | Input / Display | Description/Calculated Variables/Options |
|---|---|---|
| Distribution | ||
| Name | Display | Shows the name of the SysCAD Size Distribution (PSD) quality associated with the feed stream. |
| IntervalCount | Display | Shows the number of size intervals in the SysCAD Size Distribution (PSD) quality associated with the feed stream. |
| SpWithPSDCount | Display | Shows the number of species in the feed stream assigned with the SysCAD Size Distribution (PSD) quality. |
| Floatability | ||
| Selection | Stream | A single floatability value is specified for all species and sizes. |
| Species | Floatability values are specified per species, for all sizes of that species. | |
| Size | Floatability values are specified per size interval, for all species in that interval. | |
| Species-Size | Individual floatability values are specified for each size interval of each species. | |
| Size | Display | Size of each interval in internal mesh series. |
| MeanSize | Display | Geometric mean size of each interval in internal mesh series. |
| Floatability | Input | Floatability parameters for each size interval, in each solid species. |
Recovery page
The Recovery page is used to display (or specify) the recovery by species/component/element/individual phase and size values.
| Tag (Long/Short) | Input / Display | Description/Calculated Variables/Options |
|---|---|---|
| Distribution | ||
| Name | Display | Shows the name of the SysCAD Size Distribution (PSD) quality associated with the feed stream. |
| IntervalCount | Display | Shows the number of size intervals in the SysCAD Size Distribution (PSD) quality associated with the feed stream. |
| SpWithPSDCount | Display | Shows the number of species in the feed stream assigned with the SysCAD Size Distribution (PSD) quality. |
| Recovery | ||
| Method | Model / User | Select model-calculated or user-defined recovery to separate each solids species type. |
| Density | Display | Density of each solid species. |
| Size | Display | Size of each interval in mesh series. |
| MeanSize | Display | Geometric mean size of each interval in mesh series.
|
| All (All column) | Display |
|
| Recovery | Display |
|
| All (All row, All column) | Display |
|
| All (All row, per species) | Display |
|
| CmpRecovery | ||
| Components | Hides or shows component recovery table. | |
| Size | Display | Size of each interval in mesh series. |
| MeanSize | Display | Geometric mean size of each interval in mesh series. |
| All (All column) | Display |
|
| CmpRecovery | Display |
|
| All (All row, All column) | Display |
|
| All (All row, per component) | Display |
|
| EleRecovery | ||
| Elements | Hides or shows element recovery table. | |
| Size | Display | Size of each interval in mesh series. |
| MeanSize | Display | Geometric mean size of each interval in mesh series. |
| All (All column) | Display |
|
| EleRecovery | Display |
|
| All (All row, All column) | Display |
|
| All (All row, per element) | Display |
|
| IPhRecovery | ||
| IPhases | Hides or shows individual phases recovery table. | |
| Size | Display | Size of each interval in mesh series. |
| MeanSize | Display | Geometric mean size of each interval in mesh series. |
| All (All column) | Display |
|
| IPhRecovery | Display |
|
| All (All row, All column) | Display |
|
| All (All row, per individual phase) | Display |
|
About page
This page is provides product and licensing information about the Met Dynamics Models SysCAD Add-On.
| Tag (Long/Short) | Input / Display | Description/Calculated Variables/Options |
|---|---|---|
| About | ||
| HelpLink | Opens a link to the Installation and Licensing page using the system default web browser. Note: Internet access is required. | |
| Information | Copies Product and License information to the Windows clipboard. | |
| Product | ||
| Name | Display | Met Dynamics software product name |
| Version | Display | Met Dynamics software product version number. |
| BuildDate | Display | Build date and time of the Met Dynamics Models SysCAD Add-On. |
| License | ||
| File | This is used to locate a Met Dynamics software license file. | |
| Location | Display | Type of Met Dynamics software license or file name and path of license file. |
| SiteCode | Display | Unique machine identifier for license authorisation. |
| ReqdAuth | Display | Authorisation level required, MD-SysCAD Full or MD-SysCAD Runtime. |
| Status | Display | License status, LICENSE_OK indicates a valid license, other messages report licensing errors. |
| IssuedTo | Display | Only visible if Met Dynamics license file is used. Name of organisation/seat the license is authorised to. |
| ExpiryDate | Display | Only visible if Met Dynamics license file is used. License expiry date. |
| DaysLeft | Display | Only visible if Met Dynamics license file is used. Days left before the license expires. |
Additional notes
- Solid species that do not possess a particle size distribution property are split according to the overall mass split of the default particle size distribution species selected in the SysCAD Project Configuration.
- If the default particle size distribution species is not present in the unit feed, the overall split of all other species with particle size distributions combined is used, as determined by the model.
- Gas phase species report directly to the tailings stream without split.
External links
- Met Dynamics - Flotation (help.syscad.net)
- Crushing, Grinding and Flotation Example project (help.syscad.net)
References
- ↑ Savassi, O.N., 2005. A compartment model for the mass transfer inside a conventional flotation cell. International Journal of Mineral Processing, 77(2), pp.65-79.
- ↑ Coleman, R.G., Franzidis, J.P. and Manlapig, E., 2007. Validation of the AMIRA P9 flotation model using the floatability characterisation test rig (FCTR). Ninth Mill Operators’ Conference, Fremantle, WA, 19 - 21 March 2007.
