Crusher (Whiten)
Description
This article describes an implementation of the Whiten crusher model outlined by Napier-Munn et al. (1996).[1]
The model is useful for simulating the product particle size distribution and power draw of gyratory, jaw, cone, and impact crushers.
Model theory
The Whiten formulation considers the crushing of particles as a series of repetitive events where particles are selected or 'classified', for breakage, broken and reselected as they transit the narrowing crushing chamber.
The cycle of classification and breakage events can be represented as a steady-state mass balance of stream vectors, as shown in Figure 1 below:
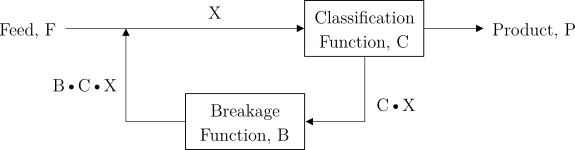
Figure 1. Schematic diagram of the breakage and classification processes in the Whiten crusher model.

A mass balance of particle mass flows around the stream [math]\displaystyle{ X }[/math] yields:
- [math]\displaystyle{ X=F+B \cdot C \cdot X }[/math]
- [math]\displaystyle{ X=P+C\ \cdot X }[/math]
Solving these simultaneous equations results in the Whiten crusher model:
- [math]\displaystyle{ P=(I-C) \cdot (I-B \cdot C)^{-1} \cdot F }[/math]
where:
- [math]\displaystyle{ F }[/math] = feed mass size distribution vector
- [math]\displaystyle{ P }[/math] = product mass size distribution vector
- [math]\displaystyle{ C }[/math] = classification function as a diagonal vector
- [math]\displaystyle{ B }[/math] = Breakage function as a lower triangular matrix
- [math]\displaystyle{ I }[/math] = Identity matrix as a diagonal vector
Elements of the Whiten crusher model equation are discussed below.
Classification
Particles are classified for breakage on a size basis. Very fine particles may bypass the breakage stage and report directly to crusher product. A fraction of the remaining particles are classified and subject to breakage processes.
The probability of particles of a given size being classified for breakage is described by the function:
- [math]\displaystyle{ C_i = \begin{cases} 0 & \text{for }\bar d_i\lt K_1\\ 1 - \left [ \dfrac{\bar d_i-K_2}{K_1-K_2} \right ]^{K_3} & \text{for }K_1\lt \bar d_i\lt K_2\\ 1 & \text{for }\bar d_i\gt K_2 \end{cases} }[/math]
where:
- [math]\displaystyle{ i }[/math] is the index of the size interval, [math]\displaystyle{ i = \{1,2,\dots,n\} }[/math], [math]\displaystyle{ n }[/math] is the number of size intervals
- [math]\displaystyle{ C_i }[/math] is the mass fraction of particles of size interval [math]\displaystyle{ i }[/math] that are classified for breakage
- [math]\displaystyle{ \bar d_i }[/math] is the geometric mean size of particles in size interval [math]\displaystyle{ i }[/math]
- [math]\displaystyle{ K_1 }[/math] is the size below which all particles are not selected for breakage and report directly to product
- [math]\displaystyle{ K_2 }[/math] is the size above which all particles are always selected for breakage
- [math]\displaystyle{ K_3 }[/math] is an exponent determining the shape of the classification function, usually a value of 2.3
Breakage
The breakage function, [math]\displaystyle{ B }[/math] is defined as the mass-by-size distribution of progeny particles resulting from the breakage of parent particles.
The Whiten crusher model uses a matrix of cumulative fraction passing data points to describe the products of a breakage event. This matrix is known as the Appearance Function and allows a complete product size distribution for any mesh series to be reconstructed from a single input parameter, the [math]\displaystyle{ t_{10} }[/math]. The [math]\displaystyle{ t_{10} }[/math] is defined as the fraction of broken particle mass that passes one-tenth of the geometric mean size of an original parent particle.
Each element of the Appearance Function matrix, [math]\displaystyle{ t_{x,y} }[/math], represents the percentage fraction of progeny particles passing one-[math]\displaystyle{ y }[/math]th of the original parent particle geometric mean size, when [math]\displaystyle{ x }[/math]% of the products pass one-tenth of the original product size (i.e. the [math]\displaystyle{ t_{10} }[/math]).
The Appearance Function for a particular ore is typically obtained from a JK Drop Weight test. An example is shown in Table 1 below:
Table 1. Example Appearance Function data [math]\displaystyle{ t_{75}(\%) }[/math] [math]\displaystyle{ t_{50}(\%) }[/math] [math]\displaystyle{ t_{25}(\%) }[/math] [math]\displaystyle{ t_{4}(\%) }[/math] [math]\displaystyle{ t_{2}(\%) }[/math] [math]\displaystyle{ t_{10}=10\% }[/math] 2.8 4.0 5.5 22.2 51.4 [math]\displaystyle{ t_{10}=20\% }[/math] 5.6 7.2 10.7 43.4 80.8 [math]\displaystyle{ t_{10}=30\% }[/math] 8.9 11.3 16.4 60.7 93.0
A cubic spline is used to interpolate [math]\displaystyle{ t_{75} }[/math] - [math]\displaystyle{ t_2 }[/math] values for an input value of [math]\displaystyle{ t_{10} }[/math]. A secondary cubic spline interpolation is then used to produce a distribution across the full mesh size interval range for each parent particle size.
[math]\displaystyle{ B }[/math] is a lower triangular matrix as all broken particles are, by definition, smaller than their parent particle.
Power draw
Crusher power, [math]\displaystyle{ P_{\rm c} }[/math] is related to the equivalent power required by a laboratory impact device (the drop weight) to achieve the same degree of breakage, and the no-load or idling power of a crusher by the following equation:
- [math]\displaystyle{ P_{\rm c} = P_{\rm n} + A \cdot P_{\rm p} }[/math]
where:
- [math]\displaystyle{ P_{\rm c} }[/math] is the power drawn by the full scale crusher
- [math]\displaystyle{ P_{\rm n} }[/math] is the power draw of the full scale crusher machine when under no load
- [math]\displaystyle{ P_{\rm p} }[/math] is the 'pendulum' power, calculated as described below
- [math]\displaystyle{ A }[/math] is a scaling factor to account for the difference between the laboratory drop weight test and full scale crusher machine
The mass of particles selected for breakage is described by the [math]\displaystyle{ C\cdot X }[/math] quantity, which from the Whiten crusher model equation yields:
- [math]\displaystyle{ C \cdot X=C \cdot (I-B \cdot C)^{-1} \cdot F }[/math]
Therefore, the total power, [math]\displaystyle{ P_{\rm c} }[/math], consumed by the breakage of particles in the crusher may be computed from:
- [math]\displaystyle{ P_{\rm c}= P_{\rm n} + A \sum_{i=1}^{n}{C_i \cdot \left [ (I-B \cdot C)^{-1} \right ]_i \cdot F_i \cdot\ (E_{\rm cs})_{i}} }[/math]
where [math]\displaystyle{ Ecs_{i} }[/math] is the specific comminution energy, or the energy per unit mass consumed by the breakage of a particle of size interval [math]\displaystyle{ i }[/math] of [math]\displaystyle{ n }[/math] total intervals, at a given value of [math]\displaystyle{ t_{10} }[/math].
A JK Drop Weight test typically provides the Energy-Size Reduction relationship for an ore, a matrix of [math]\displaystyle{ E_{\rm cs} }[/math] values for three or five parent particle sizes and three [math]\displaystyle{ t_{10} }[/math] breakage extents, as illustrated in Table 2 below:
Table 2. Example Energy-Size Reduction relationship Particle size (mm) 14.5 20.63 28.89 [math]\displaystyle{ E_{\rm cs} }[/math] (kWh/t) [math]\displaystyle{ E_{\rm cs} }[/math] (kWh/t) [math]\displaystyle{ E_{\rm cs} }[/math] (kWh/t) [math]\displaystyle{ t_{10}=10\% }[/math] 0.35 0.30 0.25 [math]\displaystyle{ t_{10}=20\% }[/math] 0.80 0.70 0.50 [math]\displaystyle{ t_{10}=30\% }[/math] 1.2 1.00 0.80
A cubic spline interpolation approach is used to estimate the [math]\displaystyle{ E_{cs} }[/math] values from the Energy-Size Reduction matrix, similarly to the Appearance Function method above.
Internal mesh series
By default, the Whiten crusher model is formulated internally with a geometric progression of 41 mesh sizes at [math]\displaystyle{ \sqrt{2} }[/math] intervals. Feed and product size fractions are automatically converted to and from the internal mesh series during model computation.
Alternatively, the user-input size intervals (the External mesh) may be used in place of the [math]\displaystyle{ \sqrt{2} }[/math] series. A combined External mesh plus [math]\displaystyle{ \sqrt{2} }[/math] series may be used internally as a final option.
The alternative internal mesh options may be useful when the default [math]\displaystyle{ \sqrt{2} }[/math] intervals are spaced too far apart to capture subtle input parameter or product size changes.
Multi-component modelling
The original Whiten crusher model formulation only considered the breakage and power draw properties of a single ore type.
This implementation allows a user to specify different Appearance Function and Energy-Size Reduction matrices for each ore type in the feed. Each ore type is crushed separately within the model.
Excel
The Whiten Crusher model may be invoked from the Excel formula bar with the following function call:
=mdUnit_Crusher_Whiten(Parameters as Range, Size as Range, CrusherFeed as Range, Appearance as Range, Ecst10Size as Range)
Invoking the function with no arguments will print Help text associated with the model, including a link to this page.
Inputs
The required inputs are defined below in matrix notation with elements corresponding to cells in Excel row ([math]\displaystyle{ i }[/math]) x column ([math]\displaystyle{ j }[/math]) format:
- [math]\displaystyle{ Parameters= \begin{bmatrix} K_1\text{ (mm)}\\ K_2\text{ (mm)}\\ K_3\text{ (-)}\\ t_{10}\text{ (}\%\text{)}\\ \text{No-load power (kW)}\\ A\text{ }(\frac{\text{kW}}{\text{kW}})\\ \text{Internal mesh method}^*\\ \end{bmatrix},\;\;\;\;\;\; Size = \begin{bmatrix} d_{1}\text{ (mm)}\\ \vdots\\ d_n\text{ (mm)}\\ \end{bmatrix},\;\;\;\;\;\; CrusherFeed= \begin{bmatrix} (Q_{\rm M,F})_{11}\text{ (t/h)} & \dots & (Q_{\rm M,F})_{1m}\text{ (t/h)}\\ \vdots & \ddots & \vdots\\ (Q_{\rm M,F})_{n1}\text{ (t/h)} & \dots & (Q_{\rm M,F})_{nm}\text{ (t/h)}\\ \end{bmatrix} }[/math]
- [math]\displaystyle{ Appearance= \begin{bmatrix} \begin{bmatrix} (t_{75})_{10}\text{ (}\%\text{)} & (t_{50})_{10}\text{ (}\%\text{)} & (t_{25})_{10}\text{ (}\%\text{)} & (t_{4})_{10}\text{ (}\%\text{)} & (t_{2})_{10}\text{ (}\%\text{)}\\ (t_{75})_{20}\text{ (}\%\text{)} & (t_{50})_{20}\text{ (}\%\text{)} & (t_{25})_{20}\text{ (}\%\text{)} & (t_{4})_{20}\text{ (}\%\text{)} & (t_{2})_{20}\text{ (}\%\text{)}\\ (t_{75})_{30}\text{ (}\%\text{)} & (t_{50})_{30}\text{ (}\%\text{)} & (t_{25})_{30}\text{ (}\%\text{)} & (t_{4})_{30}\text{ (}\%\text{)} & (t_{2})_{30}\text{ (}\%\text{)}\\ \end{bmatrix}_1\\ \vdots\\ \begin{bmatrix} (t_{75})_{10}\text{ (}\%\text{)} & (t_{50})_{10}\text{ (}\%\text{)} & (t_{25})_{10}\text{ (}\%\text{)} & (t_{4})_{10}\text{ (}\%\text{)} & (t_{2})_{10}\text{ (}\%\text{)}\\ (t_{75})_{20}\text{ (}\%\text{)} & (t_{50})_{20}\text{ (}\%\text{)} & (t_{25})_{20}\text{ (}\%\text{)} & (t_{4})_{20}\text{ (}\%\text{)} & (t_{2})_{20}\text{ (}\%\text{)}\\ (t_{75})_{30}\text{ (}\%\text{)} & (t_{50})_{30}\text{ (}\%\text{)} & (t_{25})_{30}\text{ (}\%\text{)} & (t_{4})_{30}\text{ (}\%\text{)} & (t_{2})_{30}\text{ (}\%\text{)}\\ \end{bmatrix}_m\\ \end{bmatrix},\;\;\;\;\;\; Ecst10Size= \begin{bmatrix} \begin{bmatrix} (d_{\rm p})_1\text{ (mm)} & \dots & (d_{\rm p})_k\text{ (mm)} \\ \end{bmatrix}\\ \begin{bmatrix} (E_{\rm cs})_{10,1}\text{ (kWh/t)} & \dots & (E_{\rm cs})_{10,k}\text{ (kWh/t)}\\ (E_{\rm cs})_{20,1}\text{ (kWh/t)} & \dots & (E_{\rm cs})_{20,k}\text{ (kWh/t)}\\ (E_{\rm cs})_{30,1}\text{ (kWh/t)} & \dots & (E_{\rm cs})_{30,k}\text{ (kWh/t)}\\ \end{bmatrix}_1\\ \vdots\\ \begin{bmatrix} (E_{\rm cs})_{10,1}\text{ (kWh/t)} & \dots & (E_{\rm cs})_{10,k}\text{ (kWh/t)}\\ (E_{\rm cs})_{20,1}\text{ (kWh/t)} & \dots & (E_{\rm cs})_{20,k}\text{ (kWh/t)}\\ (E_{\rm cs})_{30,1}\text{ (kWh/t)} & \dots & (E_{\rm cs})_{30,k}\text{ (kWh/t)}\\ \end{bmatrix}_m\\ \end{bmatrix} }[/math]
where:
- [math]\displaystyle{ \text{Internal mesh method}^* }[/math] is an optional input that determines the internal mesh series used by the model (0 = [math]\displaystyle{ \sqrt{2} }[/math] mesh, 1 = External mesh, 2 = External + [math]\displaystyle{ \sqrt{2} }[/math] mesh). If omitted, the default [math]\displaystyle{ \sqrt{2} }[/math] mesh is used.
- [math]\displaystyle{ n }[/math] is the number of size intervals
- [math]\displaystyle{ m }[/math] is the number of ore types
- [math]\displaystyle{ d_i }[/math] is the size of the square mesh interval that mass is retained on (mm)
- [math]\displaystyle{ d_{i+1}\lt d_i\lt d_{i-1} }[/math], i.e. descending size order from top size ([math]\displaystyle{ d_{1} }[/math]) to sub mesh ([math]\displaystyle{ d_{n}=0 }[/math] mm)
- [math]\displaystyle{ Q_{\rm M,F} }[/math] is the mass flow rate of particles in the crusher feed (t/h)
- [math]\displaystyle{ (t_{y})_x }[/math] is the fraction of mass passing one-[math]\displaystyle{ y }[/math]th the size of a parent particle (%) when [math]\displaystyle{ x\% }[/math] passes one-tenth the size of a parent particle (%), [math]\displaystyle{ y\in\{75, 50, 25,2\} }[/math], [math]\displaystyle{ x\in\{10, 20, 30\} }[/math]
- [math]\displaystyle{ d_{\rm p} }[/math] is the size of a parent particle subject to breakage for Energy-Size Reduction relationship testing (mm)
- [math]\displaystyle{ k }[/math] is the number of particle sizes subject to breakage for Energy-Size Reduction relationship testing
- [math]\displaystyle{ (E_{\rm cs})_{x,k} }[/math] is the specific comminution energy required to break a parent particle of size [math]\displaystyle{ (d_p)_k }[/math] into a distribution of progeny particles with [math]\displaystyle{ x\% }[/math] passing one-tenth of the parent size (kWh/t)
Results
The results are displayed in Excel as an array corresponding to the matrix notation below:
- [math]\displaystyle{ mdUnit\_Crusher\_Whiten = \begin{bmatrix} \begin{array}{c} \begin{bmatrix} \text{Pendulum Power (kW)}\\ \text{Gross Power (kW)} \end{bmatrix} &\\ &\\ \end{array} & \begin{bmatrix} d_1\text{ (mm)}\\ \vdots\\ d_n\text{ (mm)} \end{bmatrix} & \begin{bmatrix} (Q_{\rm M,P})_{11}\text{ (t/h)} & \dots & (Q_{\rm M,P})_{1m}\text{ (t/h)}\\ \vdots & \ddots & \vdots\\ (Q_{\rm M,P})_{n1}\text{ (t/h)} & \dots & (Q_{\rm M,P})_{nm}\text{ (t/h)}\\ \end{bmatrix}\\ \end{bmatrix} }[/math]
where [math]\displaystyle{ Q_{\rm M,P} }[/math] is the mass flow rate of particles in the crusher product (t/h).
Example
The images below show the selection of input arrays and output results in the Excel interface.
 Figure 2. Example showing the selection of the Parameters (blue frame) array in Excel. |
 Figure 3. Example showing the selection of the Size (red frame) and CrusherFeed (purple frame) arrays in Excel. |
 Figure 4. Example showing the selection of the Appearance (green frame) and Energy-Size Reduction (pink frame) arrays in Excel. |
 Figure 5. Example showing the outline of the Results (light blue frame) array in Excel. |
SysCAD
The sections and variable names used in the SysCAD interface are described in detail in the following tables.
MD_Crusher page
The first tab page in the access window will have this name.
| Tag (Long/Short) | Input / Display | Description/Calculated Variables/Options |
|---|---|---|
| Tag | Display | This name tag may be modified with the change tag option. |
| Condition | Display | OK if no errors/warnings, otherwise lists errors/warnings. |
| ConditionCount | Display | The current number of errors/warnings. If condition is OK, returns 0. |
| GeneralDescription / GenDesc | Display | This is an automatically generated description for the unit. If the user has entered text in the 'EqpDesc' field on the Info tab (see below), this will be displayed here.
If this field is blank, then SysCAD will display the unit class ID. |
| Requirements | ||
| On | CheckBox | This enables the unit. If this box is not checked, then the material will pass straight through the crusher with no change to the size distribution. |
| NumParallelUnits | Input | The number of parallel, identical units to simulate:
|
| Method | Fixed Discharge | The discharge particle size distribution is user defined. Different distributions can be used for different solids. |
| Whiten | The product size distribution and power draw are determined by the Whiten crusher model. Different parameters can be used for different solids. | |
| Impact (Kojovic) | The product size distribution and power draw are determined by the Kojovic impact crusher model. Different parameters can be used for different solids. | |
| Options | ||
| ShowQFeed | CheckBox | QFeed and associated tab pages (eg Sp) will become visible, showing the properties of the combined feed stream. |
| ShowQProd | CheckBox | QProd and associated tab pages (eg Sp) will become visible, showing the properties of the products. |
| SizeForPassingFracCalc | Input | Size fraction for % Passing calculation. The size fraction input here will be shown in the Stream Summary section. |
| FracForPassingSizeCalc | Input | Fraction passing for Size calculation. The fraction input here will be shown in the Stream Summary section. |
| Stream Summary | ||
| MassFlow / Qm | Display | The total mass flow in each stream. |
| SolidMassFlow / SQm | Display | The Solids mass flow in each stream. |
| LiquidMassFlow / LQm | Display | The Liquid mass flow in each stream. |
| VolFlow / Qv | Display | The total Volume flow in each stream. |
| Temperature / T | Display | The Temperature of each stream. |
| Density / Rho | Display | The Density of each stream. |
| SolidFrac / Sf | Display | The Solid Fraction in each stream. |
| LiquidFrac / Lf | Display | The Liquid Fraction in each stream. |
| Passing | Display | The mass fraction passing the user-specified size (in the field SizeForPassingFracCalc) in each stream. |
| Passes | Display | The user-specified (in the field FracForPassesSizeCalc) fraction of material in each stream will pass this size fraction. |
Crusher page
The Crusher page is used to specify the input parameters for the crusher model.
| Tag (Long/Short) | Input / Display | Description/Calculated Variables/Options |
|---|---|---|
| Whiten | ||
| HelpLink | Opens a link to this page using the system default web browser. Note: Internet access is required. | |
| Requirements | ||
| InternalMesh | Root 2 | A geometric mesh series at [math]\displaystyle{ \sqrt{2} }[/math] intervals is applied. Default option. |
| External | The particle size distribution mesh series present in the feed stream is used directly within the model. | |
| Root 2 + External | The [math]\displaystyle{ \sqrt{2} }[/math] and External mesh intervals are combined and used internally by the model. | |
| Parameters | ||
| K1 | Input | Classification parameter, the size below which all particles are not selected for breakage and report directly to product. |
| K2 | Input | Classification parameter, the size above which all particles are always selected for breakage. |
| K3 | Input | Classification parameter, an exponent determining the shape of the classification function, usually a value of 2.3. |
| t10 | Input | Breakage parameter, the fraction of broken particle mass that passes one-tenth of the geometric mean size of an original parent particle. |
| Power | ||
| A | Input | Power scaling parameter, accounts for the observed power difference between a laboratory drop weight test and a full scale crusher machine. |
| NoLoadPower | Input | Power draw of a full scale crusher machine when under no load (idling). |
| PendulumPower | Display | Calculated power required to crush the feed into the given product size in a laboratory testing device. |
| GrossPower | Display | Estimated power required by a full scale machine to crush the feed into the given product size. |
Ore page
This page is used to define the crusher comminution properties of SysCAD species with the size distribution quality in the project.
| Tag (Long/Short) | Input / Display | Description/Calculated Variables/Options |
|---|---|---|
| Distribution | ||
| Name | Display | Shows the name of the SysCAD Size Distribution (PSD) quality associated with the feed stream. |
| IntervalCount | Display | Shows the number of size intervals in the SysCAD Size Distribution (PSD) quality associated with the feed stream. |
| SpWithPSDCount | Display | Shows the number of species in the feed stream assigned with the SysCAD Size Distribution (PSD) quality. |
| View | ||
| ColumnView | CheckBox | Arranges the Appearance and Energy-Size Reduction data in table format (default) or column view. |
|
| ||
| Appearance | ||
| OreSpecific | CheckBox | Ore-specific parameters, allows the Appearance data to be separately input for all species. Default is all species have the same set of single input properties. This option is only available if there is more than one species in the project with the size distribution property. |
| Appearance | Input | Appearance function data |
 
| ||
| Ecs | ||
| NumEcsSizes | Input | The number of original particle sizes for which Energy-Size Reduction data was obtained in the JK Drop Weight test (usually three or five). |
| OreSpecific | CheckBox | Ore-specific parameters, allows the Energy-Size Reduction data to be separately input for all species. Default is all species have the same set of single input properties. |
| Ecs | Input | Energy-Size Reduction data |
|
| ||


About page
This page is provides product and licensing information about the Met Dynamics Models SysCAD Add-On.
| Tag (Long/Short) | Input / Display | Description/Calculated Variables/Options |
|---|---|---|
| About | ||
| HelpLink | Opens a link to the Installation and Licensing page using the system default web browser. Note: Internet access is required. | |
| Information | Copies Product and License information to the Windows clipboard. | |
| Product | ||
| Name | Display | Met Dynamics software product name |
| Version | Display | Met Dynamics software product version number. |
| BuildDate | Display | Build date and time of the Met Dynamics Models SysCAD Add-On. |
| License | ||
| File | This is used to locate a Met Dynamics software license file. | |
| Location | Display | Type of Met Dynamics software license or file name and path of license file. |
| SiteCode | Display | Unique machine identifier for license authorisation. |
| ReqdAuth | Display | Authorisation level required, MD-SysCAD Full or MD-SysCAD Runtime. |
| Status | Display | License status, LICENSE_OK indicates a valid license, other messages report licensing errors. |
| IssuedTo | Display | Only visible if Met Dynamics license file is used. Name of organisation/seat the license is authorised to. |
| ExpiryDate | Display | Only visible if Met Dynamics license file is used. License expiry date. |
| DaysLeft | Display | Only visible if Met Dynamics license file is used. Days left before the license expires. |
See also
External links
- Met Dynamics - Crusher (help.syscad.net)
- Crushing and Grinding Example project (help.syscad.net)
- Crushing, Grinding and Flotation Example project (help.syscad.net)
References
- ↑ Napier-Munn, T.J., Morrell, S., Morrison, R.D. and Kojovic, T., 1996. Mineral comminution circuits: their operation and optimisation. Julius Kruttschnitt Mineral Research Centre, Indooroopilly, QLD.