Revision as of 03:52, 23 October 2026 by imported>Scott.Munro
Description
This article describes methods for estimating particle size distributions using the Gaudin-Schuhmann, Rosin-Rammler and Swebrec equations.[1][2]
Model theory
 This content is available to registered users. Please log in to view. |
Gaudin-Schuhmann
Rosin-Rammler
Swebrec
Excel
Gaudin-Schuhmann
The Gaudin-Schuhmann distribution may be invoked from the Excel formula bar with the following function calls:
=mdDist_GaudinSchuhmann(Size as Range, k as Double, m as Double)
Invoking the function with no arguments will print Help text associated with the model, including a link to this page.
The input parameters and calculation results are defined below in matrix notation, along with an example image showing the selection of the same cells and arrays in the Excel interface:
- [math]\displaystyle{
\begin{align}
\mathit{Size} & =
\begin{bmatrix}
d_1\text{ (mm)}\\
\vdots\\
d_n\text{ (mm)}\\
\end{bmatrix}\\
\\
\mathit{k} & = \big [ k\text{ (mm)} \big ]\\
\\
\mathit{a} & = \big [ a \big ]
\end{align} }[/math]
|
- [math]\displaystyle{
\begin{align}
\mathit{mdDist\_GaudinSchuhmann} & =
\begin{bmatrix}
P_1\text{ (frac)}\\
\vdots\\
P_n\text{ (frac)}\\
\end{bmatrix}
\end{align}
}[/math]
|
|
|
|
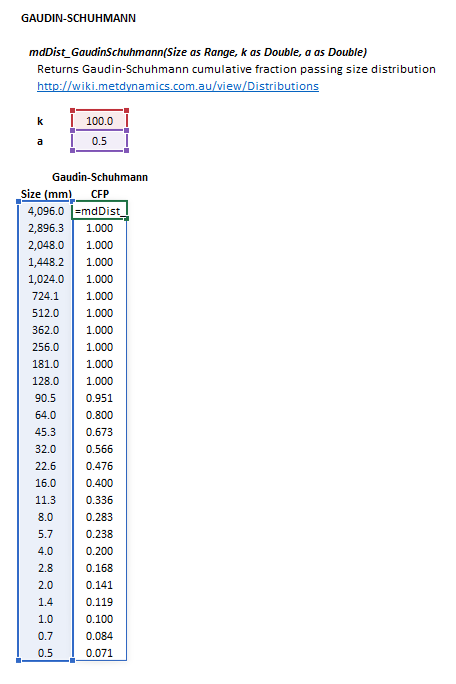 Figure 3. Example showing the selection of the Size (blue frame), k (red frame), a (purple frame) and Results (light blue frame) arrays in Excel.
|
Rosin-Rammler
The Rosin-Rammler distribution may be invoked from the Excel formula bar with the following function calls:
=mdDist_RosinRammler(Size as Range, x1 as Double, b as Double)
Invoking the function with no arguments will print Help text associated with the model, including a link to this page.
The input parameters and calculation results are defined below in matrix notation, along with an example image showing the selection of the same cells and arrays in the Excel interface:
- [math]\displaystyle{
\begin{align}
\mathit{Size} & =
\begin{bmatrix}
d_1\text{ (mm)}\\
\vdots\\
d_n\text{ (mm)}\\
\end{bmatrix}\\
\\
\mathit{x1} & = \big [ x^1\text{ (mm)} \big ]\\
\\
\mathit{b} & = \big [ b \big ]
\end{align} }[/math]
|
- [math]\displaystyle{
\begin{align}
\mathit{mdDist\_RosinRammler} & =
\begin{bmatrix}
P_1\text{ (frac)}\\
\vdots\\
P_n\text{ (frac)}\\
\end{bmatrix}
\end{align}
}[/math]
|
|
where:
- [math]\displaystyle{ d_i }[/math] is the size of the square mesh interval that feed mass is retained on (mm)
- [math]\displaystyle{ d_{i+1}\lt d_i\lt d_{i-1} }[/math], i.e. descending size order from top size ([math]\displaystyle{ d_{1} }[/math]) to sub mesh ([math]\displaystyle{ d_{n}=0 }[/math] mm)
|
|
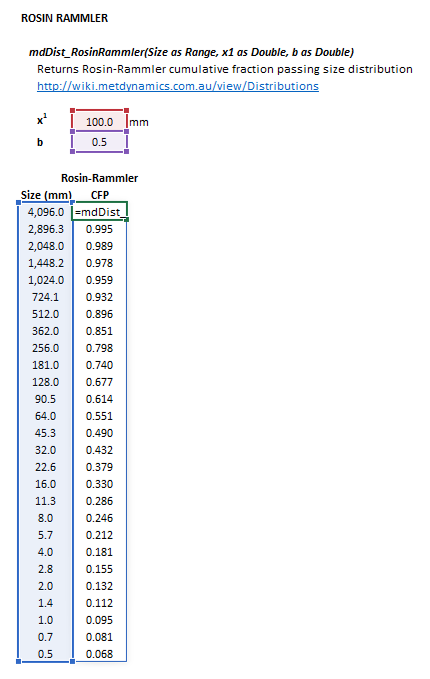 Figure 4. Example showing the selection of the Size (blue frame), x1 (red frame), b (purple frame) and Results (light blue frame) arrays in Excel.
|
Swebrec
The Swebrec distribution may be invoked from the Excel formula bar with the following function calls:
=mdDist_Swebrec(Size as Range, xMax as Double, x50 as Double, b as Double, Optional a as Double = 1, Optional c as Double = 0)
Invoking the function with no arguments will print Help text associated with the model, including a link to this page.
The input parameters and calculation results are defined below in matrix notation, along with an example image showing the selection of the same cells and arrays in the Excel interface:
- [math]\displaystyle{
\begin{align}
\mathit{Size} & =
\begin{bmatrix}
d_1\text{ (mm)}\\
\vdots\\
d_n\text{ (mm)}\\
\end{bmatrix}\\
\\
\mathit{xMax} & = \big [ x_{\rm Max}\text{ (mm)} \big ]\\
\\
\mathit{x50} & = \big [ x_{50}\text{ (mm)} \big ]\\
\\
\mathit{b} & = \big [ b \big ]\\
\\
\mathit{a} & = \big [ a \big ]^*\\
\\
\mathit{c} & = \big [ c \big ]^*
\end{align} }[/math]
|
- [math]\displaystyle{
\begin{align}
\mathit{mdDist\_Swebrec} & =
\begin{bmatrix}
P_1\text{ (frac)}\\
\vdots\\
P_n\text{ (frac)}\\
\end{bmatrix}
\end{align}
}[/math]
|
|
where [math]\displaystyle{ ^* }[/math] represents optional parameters.
The five-parameter Swebrec function is used when both optional parameters are supplied. Otherwise, the three-parameter function is used.
|
|
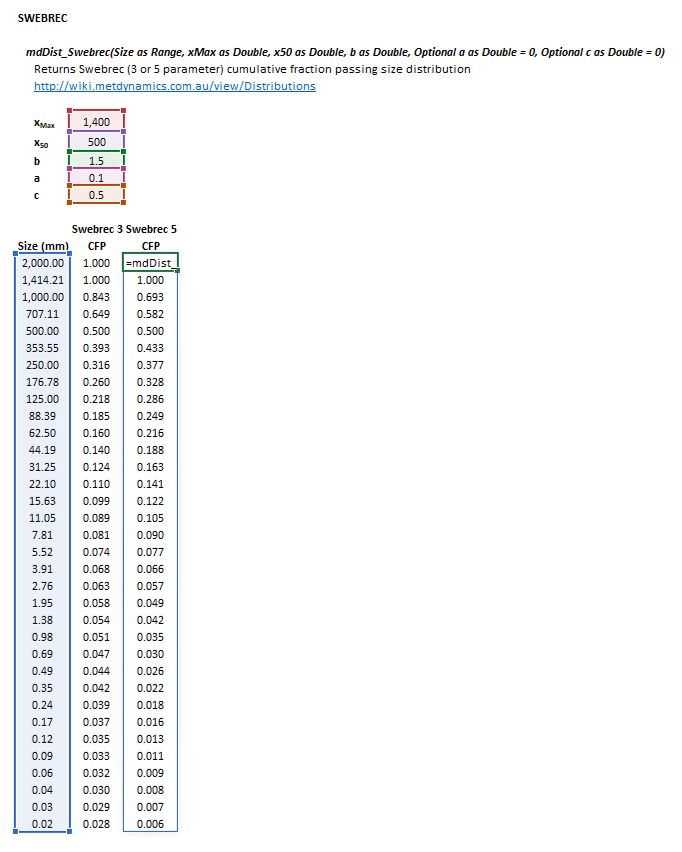 Figure 5. Example showing the selection of the Size (blue frame), xMax (red frame), x50 (purple frame), b (green frame),a (pink frame), c (brown frame) and Results (light blue frame) arrays in Excel.
|
References
- ↑ Gupta, A. and Yan, D.S., 2016. Mineral processing design and operations: an introduction. Elsevier.
- ↑ Ouchterlony, F., 2005. The Swebrec© function: linking fragmentation by blasting and crushing. Mining Technology, 114(1), pp.29-44.
 This content is available to registered users. Please log in to view.


