Vibrating Screen (Whiten)
Description
This article describes an implementation of the Whiten and White (1977) model for multi-row vibrating screen classification, with extensions by Dehghani et al. (2002) and Firth and Hart (2008).[1][2][3]
Model theory
The Whiten screen model combines particle classification with a relationship for screening across sequential rows of panels with differing aperture and open area properties.
Classification
This model applies a modified version of the Whiten and White (1977) expression for classification of particles to oversize:[1]
- [math]\displaystyle{ E_{{\rm oc}s} = \begin{cases} \exp (- n_L L f_{\rm o} \dfrac {\big [D_1 - s \big ] \big [D_2 - s \big ]}{D_1 D_2}) & s \lt D_2\\ 1.0 & s \geq D_2\\ \end{cases} }[/math]
where:
- [math]\displaystyle{ s }[/math] is the diameter of a particle (mm)
- [math]\displaystyle{ E_{{\rm oc}s} }[/math] is the corrected fraction of particles of size [math]\displaystyle{ s }[/math] in the feed reporting to the oversize stream (frac)
- [math]\displaystyle{ n_{\rm L} }[/math] is the number of trials per unit length parameter (/m)
- [math]\displaystyle{ L }[/math] is the length of the screening area (or panel) in the direction of flow (m)
- [math]\displaystyle{ f_{\rm o} }[/math] is the fraction open area of the screen deck/panels (m2/m2)
- [math]\displaystyle{ D_1 }[/math] is length (the longer side) of the screen deck/panel aperture (m)
- [math]\displaystyle{ D_2 }[/math] is width (the shorter side) of the screen deck/panel aperture (m)
Multi-row screening
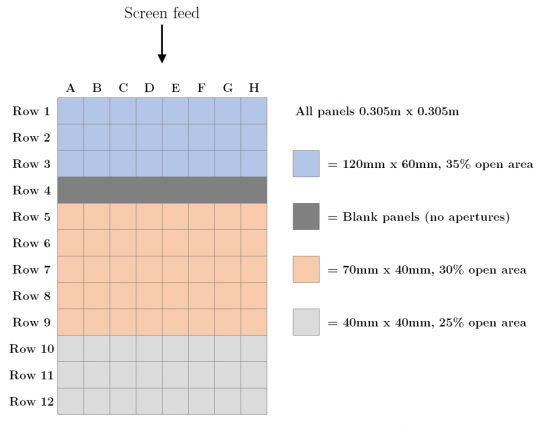
Figure 1 indicates a typical arrangement of screen panels on a screen deck. Each row of panels may exhibit a unique set of properties. Particles in the screen feed may therefore experience changing apertures sizes or open area fractions during screening, in the order of row arrangement in the flow direction.
Screening across the rows of a deck with differing properties is analogous to an arrangement of screens in series, where the oversize from the first screen (row) becomes the feed to the next screen (row), and so on. This concept is illustrated in Figures 2 and 3.
Mathematically, this is stated as:
- [math]\displaystyle{ (E_{\rm {oc}i})_{\rm {Deck}} = (E_{\rm {oc}i})_1 \times (E_{\rm {oc}i})_2 \times \dots \times (E_{\rm {oc}i})_p = \prod_{k=1}^{p}{(E_{\rm {oc}i})_k} }[/math]
and adjusted for the entrainment of fines by:
- [math]\displaystyle{ (E_{{\rm oa}i})_{\rm {Deck}} = (E_{{\rm oc}i})_{\rm {Deck}} + \left ( 1 - (E_{{\rm oc}i})_{\rm {Deck}} \right ) \cdot R_{\rm f} \exp(-\lambda \bar d_i) }[/math]
where:
- [math]\displaystyle{ (E_{\rm {oc}i})_{\rm {Deck}} }[/math] is the corrected fraction of the feed to the screen deck in size interval [math]\displaystyle{ i }[/math] recovered to the deck oversize stream (frac)
- [math]\displaystyle{ (E_{\rm {oc}i})_k }[/math] is the corrected fraction of the feed to panel row [math]\displaystyle{ k }[/math] in size interval [math]\displaystyle{ i }[/math] recovered to the row oversize stream (frac)
- [math]\displaystyle{ (E_{\rm {oa}i})_{\rm {Deck}} }[/math] is the actual fraction of the feed to the screen deck in size interval [math]\displaystyle{ i }[/math] recovered to the deck oversize stream (frac)
- [math]\displaystyle{ p }[/math] is the number of panel rows with apertures permitting the passage of particles
Classification for each row is computed via the modified Whiten and White equation presented above. The same [math]\displaystyle{ n_{\rm L} }[/math] parameter is applied to all rows as a simplification.
Screen efficiency
Screen efficiency, or the efficiency of undersize removal, [math]\displaystyle{ E_{\rm US} }[/math] (frac), is defined as "the fraction of sub-aperture material in the feed stream which is actually recovered to the undersize stream". Formally,
- [math]\displaystyle{ E_{\rm US} = \dfrac{ Q_{\rm M, US}}{(Q_{\rm M, F}).P_{\rm Aperture} } }[/math]
where:
- [math]\displaystyle{ Q_{\rm {M,US}} }[/math] is the mass flow rate of particles in the undersize stream (t/h)
- [math]\displaystyle{ Q_{\rm {M,F}} }[/math] is the mass flow rate of particles in the feed stream (t/h)
- [math]\displaystyle{ P_{\rm {Aperture}} }[/math] is the mass fraction of particles in the feed which are smaller than the aperture size (w/w)
The efficiency of a given screen feed and deck configuration is a function of the [math]\displaystyle{ n_{\rm L} }[/math] model parameter.
Alternatively, the [math]\displaystyle{ n_{\rm L} }[/math] value required to achieve a target efficiency value for a given screen and feed may be found by the model with a numerical root-finding algorithm.
Multiple decks
Screens with multiple decks can be simulated by stacking model instances, i.e.:
- The undersize stream from the first deck becomes the feed to the next deck, and so on.
- Each deck yields an oversize stream, which can remain separated or combined into an overall oversize stream, depending on the screen and circuit configuration.
The overall efficiency of a multi-deck screen may be computed with the screen feed and final deck undersize streams in place of deck feed and deck undersize.
Excel
The Whiten vibrating screen model may be invoked from the Excel formula bar with the following function call:
=mdUnit_Screen_Whiten(Parameters as Range, Size as Range, Feed as Range, Rows as Range)
Invoking the function with no arguments will print Help text associated with the model, including a link to this page.
Inputs
The required inputs are defined below in matrix notation with elements corresponding to cells in Excel row ([math]\displaystyle{ i }[/math]) x column ([math]\displaystyle{ j }[/math]) format:
- [math]\displaystyle{ Parameters= \begin{bmatrix} \text{Method}\\ d_{\rm AR} \text{ (mm/mm)}\\ R_{\rm f} \text{ (frac)}\\ \lambda\\ (E_{\rm US})_{\rm T} \text{ (frac)}\\ n_{\rm L} \text{ (/m)}\\ \end{bmatrix},\;\;\;\;\;\; Size = \begin{bmatrix} d_{1}\text{ (mm)}\\ \vdots\\ d_n\text{ (mm)}\\ \end{bmatrix},\;\;\;\;\;\; Feed= \begin{bmatrix} (Q_{\rm M,F})_{11}\text{ (t/h)} & \dots & (Q_{\rm M,F})_{1m}\text{ (t/h)}\\ \vdots & \ddots & \vdots\\ (Q_{\rm M,F})_{n1}\text{ (t/h)} & \dots & (Q_{\rm M,F})_{nm}\text{ (t/h)}\\ \end{bmatrix},\;\;\;\;\;\; Rows= \begin{bmatrix} L_1\text{ (m)} & (D_1)_1\text{ (mm)} & (D_2)_1\text{ (mm)} & (f_{\rm o})_1\text{ (m}^2\text{/m}^2\text{)}\\ \vdots & \vdots & \vdots & \vdots\\ L_p\text{ (m)} & (D_1)_p\text{ (mm)} & (D_2)_p\text{ (mm)} & (f_{\rm o})_p\text{ (m}^2\text{/m}^2\text{)}\\ \end{bmatrix}\;\;\;\;\;\; }[/math]
where:
- [math]\displaystyle{ \text{Method} }[/math] indicates whether the model applies a user-specified [math]\displaystyle{ n_L }[/math] parameter or solves the [math]\displaystyle{ n_L }[/math] value required to achieve a user-specified target efficiency (0 = Specify nL, 1 = Specify Efficiency)
- [math]\displaystyle{ (E_{\rm US})_{\rm T} }[/math] is the target screen efficiency (frac) if [math]\displaystyle{ \text{Method}=1 }[/math], ignored otherwise
- [math]\displaystyle{ n_{\rm L} }[/math] is number of trials parameter (/m) applied if [math]\displaystyle{ \text{Method}=0 }[/math], ignored otherwise
- [math]\displaystyle{ d_i }[/math] is the size of the square mesh interval that feed mass is retained on (mm)
- [math]\displaystyle{ m }[/math] is the number of ore types
- [math]\displaystyle{ Q_{\rm M,F} }[/math] is feed solids mass flow rate by size and ore type (t/h)
Results
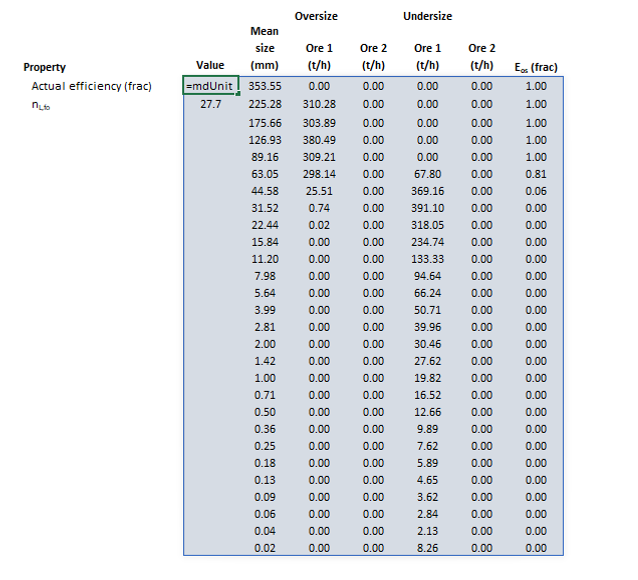
The results are displayed in Excel as an array corresponding to the matrix notation below:
- [math]\displaystyle{ mdUnit\_Screen\_Whiten = \begin{bmatrix} \begin{array}{c} \begin{bmatrix} (E_{\rm US})_{\rm A}\\ n_{\rm L} \text{ (/m)}\\ \end{bmatrix} &\\ &\\ \end{array} & \begin{bmatrix} \bar d_1\text{ (mm)}\\ \vdots\\ \bar d_n\text{ (mm)} \end{bmatrix} & \begin{bmatrix} (Q_{\rm M,OS})_{11}\text{ (t/h)} & \dots & (Q_{\rm M,OS})_{1m}\text{ (t/h)}\\ \vdots & \ddots & \vdots\\ (Q_{\rm M,OS})_{n1}\text{ (t/h)} & \dots & (Q_{\rm M,OS})_{nm}\text{ (t/h)}\\ \end{bmatrix} & \begin{bmatrix} (Q_{\rm M,US})_{11}\text{ (t/h)} & \dots & (Q_{\rm M,US})_{1m}\text{ (t/h)}\\ \vdots & \ddots & \vdots\\ (Q_{\rm M,US})_{n1}\text{ (t/h)} & \dots & (Q_{\rm M,US})_{nm}\text{ (t/h)}\\ \end{bmatrix} & \begin{bmatrix} (E_{\rm oa})_1\text{ (frac)}\\ \vdots\\ (E_{\rm oa})_n\text{ (frac)} \end{bmatrix} \end{bmatrix} }[/math]
where:
- [math]\displaystyle{ (E_{\rm US})_{\rm A} }[/math] is the actual efficiency of undersize removal achieved by the screen (frac)
- [math]\displaystyle{ n_{\rm L} }[/math] is number of trials parameter (/m) specified by the user if [math]\displaystyle{ \text{Method}=0 }[/math], or required to achieve the target efficiency if if [math]\displaystyle{ \text{Method}=1 }[/math]
- [math]\displaystyle{ Q_{\rm M,OS} }[/math] is mass flow rate of solids to the oversize stream (t/h)
- [math]\displaystyle{ Q_{\rm M,US} }[/math] is mass flow rate of solids to the undersize stream (t/h)
Example
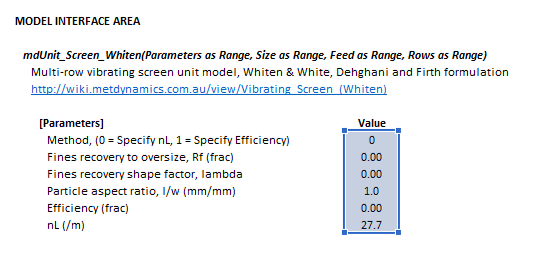
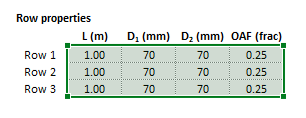
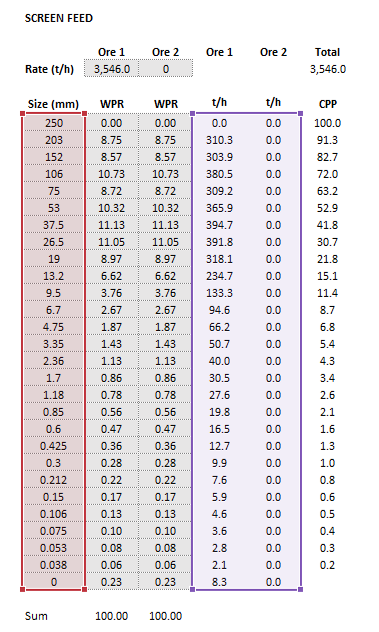
The images below show the selection of input arrays and output results in the Excel interface.
SysCAD
The sections and variable names used in the SysCAD interface are described in detail in the following tables.
Note that a Deck and Partition page is provided provided for each connected oversize discharge stream.
MD_Screen page
The first tab page in the access window will have this name.
| Tag (Long/Short) | Input / Display | Description/Calculated Variables/Options |
|---|---|---|
| Tag | Display | This name tag may be modified with the change tag option. |
| Condition | Display | OK if no errors/warnings, otherwise lists errors/warnings. |
| ConditionCount | Display | The current number of errors/warnings. If condition is OK, returns 0. |
| GeneralDescription / GenDesc | Display | This is an automatically generated description for the unit. If the user has entered text in the 'EqpDesc' field on the Info tab (see below), this will be displayed here.
If this field is blank, then SysCAD will display the unit class ID. |
| Requirements | ||
| On | CheckBox | This enables the unit. If this box is not checked, then the MassFracToOS option appears below. |
| MassFracToOS | Input | Only appears if the On field above is not checked. Specifies the fraction of feed mass that reports to the overflow stream when the model is off. |
| NumParallelUnits | Input | The number of parallel, identical units to simulate:
|
| Options | ||
| ShowQFeed | CheckBox | QFeed and associated tab pages (eg Sp) will become visible, showing the properties of the combined feed stream. |
| SizeForPassingFracCalc | Input | Size fraction for % Passing calculation. The size fraction input here will be shown in the Stream Summary section. |
| FracForPassingSizeCalc | Input | Fraction passing for Size calculation. The fraction input here will be shown in the Stream Summary section. |
| Stream Summary | ||
| MassFlow / Qm | Display | The total mass flow in each stream. |
| SolidMassFlow / SQm | Display | The Solids mass flow in each stream. |
| LiquidMassFlow / LQm | Display | The Liquid mass flow in each stream. |
| VolFlow / Qv | Display | The total Volume flow in each stream. |
| Temperature / T | Display | The Temperature of each stream. |
| Density / Rho | Display | The Density of each stream. |
| SolidFrac / Sf | Display | The Solid Fraction in each stream. |
| LiquidFrac / Lf | Display | The Liquid Fraction in each stream. |
| Passing | Display | The mass fraction passing the user-specified size (in the field SizeForPassingFracCalc) in each stream. |
| Passes | Display | The user-specified (in the field FracForPassesSizeCalc) fraction of material in each stream will pass this size fraction. |
Deck page
The Deck page is used to specify the required model method and associated input parameters.
| Tag (Long/Short) | Input / Display | Description/Calculated Variables/Options |
|---|---|---|
| Deck | ||
| On | Checkbox | This enables the deck. If off, the feed to this deck passes directly to the next deck (or undersize) without partition. |
| Method | Partition (User) | The partition to oversize for each size interval is defined by the user. Different values can be used for different solids. |
| Partition (Reid-Plitt) | The partition to oversize for each size interval is defined by a Reid-Plitt efficiency curve. Different parameters can be used for different solids. | |
| Partition (Whiten-Beta) | The partition to oversize for each size interval is defined by a Whiten-Beta efficiency curve. Different parameters can be used for different solids. | |
| Vibrating (Karra) | The Karra vibrating screen model is used to determine the partition of solids to oversize and undersize for each size interval. | |
| Vibrating (Whiten) | The Whiten vibrating screen model is used to determine the partition of solids to oversize and undersize for each size interval. | |
| Vibrating (Metso) | The Metso vibrating screen model is used to determine the partition of solids to oversize and undersize for each size interval. | |
| Fine Wet (Mwale) | The Mwale fine wet screen model is used to determine the partition of solids to oversize and undersize for each size interval. | |
| Dewatering (Ng) | The Ng dewatering screen model is used to determine the moisture content of oversize material, and the partition of solids to oversize and undersize for each size interval. | |
| HelpLink | Opens a link to this page using the system default web browser. Note: Internet access is required. | |
| Parameters | ||
| Method | Specify nL | The user specifies the value of the nL parameter and efficiency is computed. |
| Specify Efficiency | The value of the nL parameter is adjusted to achieve a user-specified target efficiency value. | |
| nL | Input | User specified value of the nL parameter. Only visible if the Specify nL method is selected above. |
| Efficiency | Input | User specified target value of screen efficiency. Only visible if Specify Efficiency method is selected above. |
| ParticleAspectRatio / ParticleAR | Input | Value of the particle aspect ratio, i.e. (second longest dimension):(longest dimension). |
| Rf | Input | Fines recovery parameter, fraction of the finest particles or liquids split to oversize stream. |
| Lambda | Input | Fines recovery parameter, shape factor. |
| Rows | ||
| NumRows | Input | Number of screen panel rows. |
| L | Input | Length of the row in the direction of travel. |
| D1 | Input | Aperture length. |
| D2 | Input | Aperture width. |
| OpenArea / fo | Input | Open area fraction of the row. |
| Liquids | ||
| LiquidsSeparMethod | Split To OS (User) | Liquids are split to oversize by a user-defined fraction of liquids in the feed. |
| Split To OS (Rf) | Liquids are split to oversize by the Rf fraction specified for the screen model. | |
| OS Solids Fraction | Sufficient liquids mass is recovered to the oversize stream to yield the user-defined oversize solids mass fraction value (if possible). | |
| OS Liquids Fraction | Sufficient liquids mass is recovered to the oversize stream to yield the user-defined oversize liquids mass fraction value (if possible). | |
| OSSolidsFracReqd / OS.SfReqd | Input | Required value of the mass fraction of solids in the oversize stream. Only visible if OS Solids Fraction is selected. |
| OSLiquidsFracReqd / OS.LfReqd | Input | Required value of the mass fraction of liquids in the oversize stream. Only visible if OS Liquids Fraction is selected. |
| LiqSplitToOS / OS.LiqSplit | Input/Display | The fraction of feed liquids recovered to the oversize stream. |
| Results | ||
| Efficiency | Display | Actual efficiency of undersize removal achieved by the deck. |
| nL | Display | Value of nL used for the deck at the actual efficiency. |
Partition page
The Partition page is used to display (or specify) the partition by species/component/element/individual phase and size values.
| Tag (Long/Short) | Input / Display | Description/Calculated Variables/Options |
|---|---|---|
| Distribution | ||
| Name | Display | Shows the name of the SysCAD Size Distribution (PSD) quality associated with the feed stream. |
| IntervalCount | Display | Shows the number of size intervals in the SysCAD Size Distribution (PSD) quality associated with the feed stream. |
| SpWithPSDCount | Display | Shows the number of species in the feed stream assigned with the SysCAD Size Distribution (PSD) quality. |
| Partition | ||
| Method | Model / User | Select model-calculated or user-defined partition to separate each solids species type. |
| Density | Display | Density of each solid species. |
| Size | Display | Size of each interval in mesh series. |
| MeanSize | Display | Geometric mean size of each interval in mesh series.
|
| All (All column) | Display |
|
| Partition | Display |
|
| All (All row, All column) | Display |
|
| All (All row, per species) | Display |
|
| CmpPartition | ||
| Components | Hides or shows component partition table. | |
| Size | Display | Size of each interval in mesh series. |
| MeanSize | Display | Geometric mean size of each interval in mesh series. |
| All (All column) | Display |
|
| CmpPartition | Display |
|
| All (All row, All column) | Display |
|
| All (All row, per component) | Display |
|
| ElePartition | ||
| Elements | Hides or shows element partition table. | |
| Size | Display | Size of each interval in mesh series. |
| MeanSize | Display | Geometric mean size of each interval in mesh series. |
| All (All column) | Display |
|
| ElePartition | Display |
|
| All (All row, All column) | Display |
|
| All (All row, per element) | Display |
|
| IPhPartition | ||
| IPhases | Hides or shows individual phases partition table. | |
| Size | Display | Size of each interval in mesh series. |
| MeanSize | Display | Geometric mean size of each interval in mesh series. |
| All (All column) | Display |
|
| IPhPartition | Display |
|
| All (All row, All column) | Display |
|
| All (All row, per individual phase) | Display |
|
About page
This page is provides product and licensing information about the Met Dynamics Models SysCAD Add-On.
| Tag (Long/Short) | Input / Display | Description/Calculated Variables/Options |
|---|---|---|
| About | ||
| HelpLink | Opens a link to the Installation and Licensing page using the system default web browser. Note: Internet access is required. | |
| Information | Copies Product and License information to the Windows clipboard. | |
| Product | ||
| Name | Display | Met Dynamics software product name |
| Version | Display | Met Dynamics software product version number. |
| BuildDate | Display | Build date and time of the Met Dynamics Models SysCAD Add-On. |
| License | ||
| File | This is used to locate a Met Dynamics software license file. | |
| Location | Display | Type of Met Dynamics software license or file name and path of license file. |
| SiteCode | Display | Unique machine identifier for license authorisation. |
| ReqdAuth | Display | Authorisation level required, MD-SysCAD Full or MD-SysCAD Runtime. |
| Status | Display | License status, LICENSE_OK indicates a valid license, other messages report licensing errors. |
| IssuedTo | Display | Only visible if Met Dynamics license file is used. Name of organisation/seat the license is authorised to. |
| ExpiryDate | Display | Only visible if Met Dynamics license file is used. License expiry date. |
| DaysLeft | Display | Only visible if Met Dynamics license file is used. Days left before the license expires. |
Additional notes
- Solid species that do not possess a particle size distribution property are split according to the overall mass split of the default particle size distribution species selected in the SysCAD Project Configuration.
- If the default particle size distribution species is not present in the unit feed, the overall split of all other species with particle size distributions combined is used, as determined by the model.
- Gas phase species report directly to the undersize stream without split.
See also
References
- ↑ 1.0 1.1 Whiten, W.J. and White, M.E., 1977. Modelling and simulation of high tonnage crushing plants. In: Proceedings of the 12th International Mineral Processing Congress, vol. II. Sao Paulo, pp. 148–158.
- ↑ Dehghani, A., Monhemius, A.J. and Gochin, R.J., 2002. Evaluating the Nakajima et al. model for rectangular-aperture screens. Minerals engineering, 15(12), pp.1089-1094.
- ↑ Firth, B. and Hart, G., 2008. Some aspects of modeling partition curves for size classification. International journal of coal preparation and utilization, 28(3), pp.174-187.
