Tumbling Mill (Power, Hilden and Powell)
Description
This article describes the Hilden and Powell (2018) approach for estimating the power draw of a tumbling mill.[1]
Hilden and Powell extended Morrell's (1996, 2016) approaches to include the following features:[2][3]
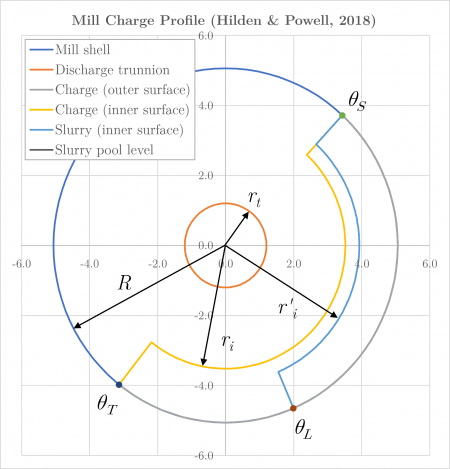
- Partial filling of the charge void space with slurry in two directions, from the charge shoulder towards the toe and from the outer shell towards the mill centre
- Estimation of the fraction of a slurry pool which settles across the centre of the mill profile and thus does not contribute to power draw
- No-load power based on mill drive type and size
Model theory
Hilden and Powell's approach adopts Morrell's (1996) expression for tumbling mill power draw:[2]
- [math]\displaystyle{ \text{Gross power (kW)} = \text{No-load power} + (k \times \text{Charge motion power}) }[/math]
where [math]\displaystyle{ k }[/math] is a lumped calibration parameter accounting for power losses.
Hilden and Powell expand Morrell's expression to:
- [math]\displaystyle{ P = P_{\rm N} + k.(P_{\rm L} + P'_{\rm L} + P_{\rm C} + P'_{\rm C}) }[/math]
where:
- [math]\displaystyle{ P }[/math] is the gross power draw of the mill (kW)
- [math]\displaystyle{ P_{\rm N} }[/math] is the no-load power draw of the mill (kW)
- [math]\displaystyle{ P_{\rm L} }[/math] is the power drawn by the charge component in the cylindrical section of the mill (kW)
- [math]\displaystyle{ P'_{\rm L} }[/math] is the power drawn by the slurry component in the cylindrical section of the mill (kW)
- [math]\displaystyle{ P_{\rm C} }[/math] is the power drawn by the charge component in the cone end sections of the mill (kW)
- [math]\displaystyle{ P'_{\rm C} }[/math] is the power drawn by the slurry component in the cone end sections of the mill (kW)
Hilden and Powell correct Morrell's value of [math]\displaystyle{ k }[/math] of 1.26 to a value of 1.25 based on analysis of an updated data set with the model relations outlined below.
Sub-components of the gross power equation are described below.
Charge motion power
Using Morrell's (1996) equations, the power drawn by the charge component in the cylindrical and cone end sections of the mill, [math]\displaystyle{ P_{\rm L} }[/math] and [math]\displaystyle{ P_{\rm C} }[/math], are:[2]
- [math]\displaystyle{ P_{\rm L} = \frac{\pi g L \rho_{\rm c} N_{\rm m} R}{3(R - zr_{\rm i})} \left [ 2R^3 -3zR^2r_{\rm i} + r_{\rm i}^3(3z-2) \right ].(\sin \theta_{\rm S} - \sin \theta_{\rm T}) + L \rho_{\rm c} \left ( \frac{\pi N_{\rm m} R}{R - zr_{\rm i}} \right )^3 \left [ (R-zr_{\rm i})^4 - r_{\rm i}^4(z-1)^4 \right ] }[/math]
- [math]\displaystyle{ P_{\rm C} = \frac{\pi g L_{\rm d} \rho_{\rm c} N_{\rm m}}{3(R-r_{\rm T})}(R^4 - 4Rr_{\rm i}^3 + 3r_{\rm i}^4)(\sin \theta_{\rm S} - \sin \theta_{\rm T}) + \frac{2 \pi^3 N_{\rm m}^3 L_{\rm d} \rho_{\rm c}}{5(R-r_{\rm T})}(R^5 - 5Rr_{\rm i}^4 + 4r_{\rm i}^5) }[/math]
where:
- [math]\displaystyle{ L }[/math] is length of the cylindrical section (belly) of the mill inside liners (m)
- [math]\displaystyle{ L_{\rm d} }[/math] is length of the cone end (m)
- [math]\displaystyle{ g }[/math] is acceleration due to gravity (m/s2)
- [math]\displaystyle{ N_{\rm m} }[/math] is the rotational rate of the mill (rev/s)
- [math]\displaystyle{ \rho_{\rm c} }[/math] is the density of the total charge (t/m3)
- [math]\displaystyle{ R }[/math] is the mill radius inside liners (m), which is half the mill diameter [math]\displaystyle{ D }[/math], i.e. [math]\displaystyle{ R=0.5D }[/math]
- [math]\displaystyle{ r_{\rm T} }[/math] is the trunnion radius inside liners (m), which is half the trunnion diameter [math]\displaystyle{ d_{\rm T} }[/math], i.e. [math]\displaystyle{ r_{\rm T}=0.5d_{\rm T} }[/math]
- [math]\displaystyle{ r_{\rm i} }[/math] is the inner surface radius of the charge (m)
- [math]\displaystyle{ \theta_{\rm S} }[/math] is the angle of the charge shoulder (radians)
- [math]\displaystyle{ \theta_{\rm T} }[/math] is the angle of the charge toe (radians)
- [math]\displaystyle{ z }[/math] is an empirical term that relates the rotational rate of mass at radial positions within the charge to the rotational rate of the mill
and all angles are unit circle positive.
The length of the cone end, [math]\displaystyle{ L_{\rm d} }[/math] (m), is:
- [math]\displaystyle{ L_{\rm d} = (R - r_{\rm T}) \tan \alpha_{c} }[/math]
where [math]\displaystyle{ \alpha_{\rm c} }[/math] is the angular displacement of the cone surface from the vertical direction (rad).
The parameter [math]\displaystyle{ z }[/math] is:
- [math]\displaystyle{ z = \left ( 1 - J_{\rm T} \right )^{0.4532} }[/math]
where [math]\displaystyle{ J_{\rm T} }[/math] is the total mill filling of balls plus rocks (v/v).
The power drawn by the slurry component in the cylindrical and cone end sections, [math]\displaystyle{ P'_{\rm L} }[/math] and [math]\displaystyle{ P'_{\rm C} }[/math], is computed by substituting the slurry component properties [math]\displaystyle{ \rho'_c }[/math], [math]\displaystyle{ r'_{\rm i} }[/math], [math]\displaystyle{ z' }[/math], and [math]\displaystyle{ \theta_{\rm L} }[/math] for the equivalent charge properties [math]\displaystyle{ \rho_{\rm c} }[/math], [math]\displaystyle{ r_{\rm i} }[/math], [math]\displaystyle{ z }[/math], and [math]\displaystyle{ \theta_{\rm T} }[/math] in the same equations for [math]\displaystyle{ P_{\rm L} }[/math] and [math]\displaystyle{ P_{\rm C} }[/math], where:
- [math]\displaystyle{ \rho'_c }[/math] is the density of the slurry component in the mill (t/m3)
- [math]\displaystyle{ r'_{\rm i} }[/math] is the inner surface radius of the slurry component (m)
- [math]\displaystyle{ z' }[/math] is an empirical term that relates the rotational rate of mass at radial positions within the slurry component to the rotational rate of the mill
- [math]\displaystyle{ \theta_{\rm L} }[/math] is the angle of the toe of the slurry component (radians)
The parameter [math]\displaystyle{ z' }[/math] is:
- [math]\displaystyle{ z' = \left ( 1 - J'_{\rm T} \right )^{0.4532} }[/math]
where [math]\displaystyle{ J'_{\rm T} }[/math] is the apparent filling for slurry (v/v), i.e.:
- [math]\displaystyle{ J'_{\rm T} = \begin{cases} U.J_{\rm T} & U \leq 1\\ J_{\rm T} + (U - 1) . U . \varepsilon & U\gt 1 \end{cases} }[/math]
and [math]\displaystyle{ U }[/math] is defined as the volume fraction of the charge void space occupied by slurry (v/v).
The remaining parameters of the charge motion power equations are described below.
Charge position
The charge shoulder and toe positions and inner surface radius are calculated using Morrell's (1996) method.[2]
The position of the toe of the charge, [math]\displaystyle{ \theta_{\rm T} }[/math] (rad), is defined as:
- [math]\displaystyle{ \theta_{\rm T} = 2.5307 \left ( 1.2796 - J_{\rm t} \right ) \left (1 - {\rm e}^{-19.42(\phi_{\rm c} - \phi)} \right ) + \frac{\pi}{2} }[/math]
where [math]\displaystyle{ \phi }[/math] (frac) is the theoretical fraction critical speed, and the fraction of critical speed at which centrifuging actually occurs, [math]\displaystyle{ \phi_{\rm c} }[/math] (frac), is:
- [math]\displaystyle{ \phi_{\rm c} = \begin{cases} \phi & \phi\gt 0.35(3.364-J_{\rm T}\\ 0.35(3.364-J_{\rm T}& \phi \leq 0.35(3.364-J_{\rm T}\\ \end{cases} }[/math]
The position of the shoulder of the charge, [math]\displaystyle{ \theta_{\rm S} }[/math] (rad), is:
- [math]\displaystyle{ \theta_{\rm S} = \frac{\pi}{2} - \left ( \theta_{\rm T} - \frac{\pi}{2} \right ) \big[ \left ( 0.336 + 0.1041 \phi \right ) + \left (1.54 - 2.5673 \phi \right ) J_{\rm T} \big] }[/math]
The inner surface radius of the charge, [math]\displaystyle{ r_{\rm i} }[/math] (m) is:
- [math]\displaystyle{ r_{\rm i} = R \sqrt{1 - \frac{2 \pi \beta J_{\rm T}}{2 \pi + \theta_{\rm S} - \theta_{\rm T}}} }[/math]
where the active load fraction, [math]\displaystyle{ \beta }[/math] (frac), is:
- [math]\displaystyle{ \beta = \frac{\left ( \dfrac{2 \pi + \theta_{\rm S} - \theta_{\rm T}}{\pi N_{\rm m}} \right )}{\sqrt{\dfrac{R}{g} \left ( 1 + \sqrt{1 - \dfrac{2 \pi J_{\rm T}}{2 \pi + \theta_{\rm S} - \theta_{\rm T}} } \right ) (\sin \theta_{\rm S} - \sin \theta_{\rm T})} + \left( \dfrac{2 \pi + \theta_{\rm S} - \theta_{\rm T}}{\pi N_{\rm m}} \right )} }[/math]
Slurry position
The position of the shoulder of the slurry component is the same as the charge shoulder position.
The position of the toe of the slurry component varies based on the filling of the charge void space, [math]\displaystyle{ U }[/math]:
- if [math]\displaystyle{ U\leq1 }[/math] then the charge void space is partially or exactly filled with slurry and [math]\displaystyle{ \theta_{\rm L} \geq \theta_{\rm T} }[/math]
- if [math]\displaystyle{ U\gt 1 }[/math] then there is an excess of slurry beyond the available charge void space, which manifests as a slurry pool, and [math]\displaystyle{ \theta_{\rm L} \lt \theta_{\rm T} }[/math].
Slurry toe when U≤1
When the charge void space is partially or exactly filled with slurry ([math]\displaystyle{ U\leq1 }[/math]), the position of the toe of the slurry component, [math]\displaystyle{ \theta_{\rm L} }[/math] (rad), is:
- [math]\displaystyle{ \theta_{\rm L} = \theta_{\rm T} + (2 \pi + \theta_{\rm S} - \theta_{\rm T}).(1 - U).y }[/math]
where [math]\displaystyle{ y }[/math] is the profile shape factor (frac).
The inner surface radius of the slurry component, [math]\displaystyle{ r'_{\rm i} }[/math] (m), is:
- [math]\displaystyle{ r'_{\rm i} = \sqrt{R^2 - \frac{U(R^2-r_{\rm i}^2).(2\pi+\theta_{\rm S}-\theta_{\rm T})}{2\pi+\theta_{\rm S}-\theta_{\rm L}}} }[/math]
Slurry toe when U>1
When the charge void space is overfilled ([math]\displaystyle{ U\gt 1 }[/math]), a slurry pool forms.
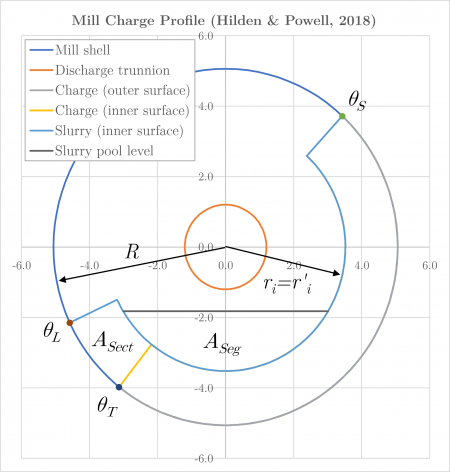
Hilden and Powell conceptualised the slurry pool as occupying two areas within the mill, as illustrated in Figure 3:
- in the annular sector at the toe of the charge ([math]\displaystyle{ A_{\rm Sect} }[/math]), and
- in the circular segment settled across the centre of the mill ([math]\displaystyle{ A_{\rm Seg} }[/math]).
Only the slurry in the annular sector ([math]\displaystyle{ A_{\rm Sect} }[/math]) contributes to power draw.
The inner surface radius of the slurry component filling the charge void space and extending into the annular sector is equal to the charge radius, i.e. [math]\displaystyle{ r'_{\rm i} = r_{\rm i} }[/math].
Locating the position of the toe of the slurry component, [math]\displaystyle{ \theta_{\rm L} }[/math], then becomes a problem of determining the distribution of slurry between the two areas, [math]\displaystyle{ A_{\rm Seg} }[/math] and [math]\displaystyle{ A_{\rm Sect} }[/math].
The total area of excess slurry, [math]\displaystyle{ A_x }[/math] (m2), in the pool is:
- [math]\displaystyle{ A_x = A_{\rm Seg} + A_{\rm Sect} = (U - 1) . \frac{1}{2} (R^2 - r_{\rm i}^2).(2 \pi + \theta_{\rm S} - \theta_{\rm T}) }[/math]
The area of the annular segment, [math]\displaystyle{ A_{\rm Seg} }[/math], is:
- [math]\displaystyle{ A_{\rm Seg} = \begin{cases} r_{\rm i}^2 . \arccos \left ( \frac{h}{r_{\rm i}} \right ) - h . \sqrt{r_{\rm i}^2 - h^2} & \text{if }h\lt r_{\rm i}\\ \left ( r_{\rm i}^2.\arccos \left ( \frac{h}{r_{\rm i}} \right ) - h.\sqrt{r_{\rm i}^2 - h^2} \right ) - \left ( r_{\rm i}^2.\arccos \left ( \frac{h_2}{r_{\rm i}} \right ) - h_2.\sqrt{r_{\rm i}^2 - h_2^2} \right ) & \text{if }h\lt r_{\rm i} \text{ and }h_2\lt r_{\rm i} \end{cases} }[/math]
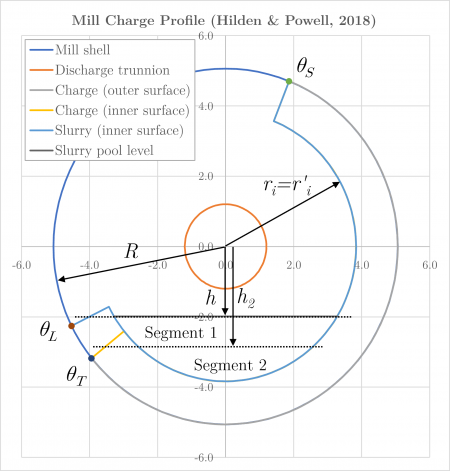
where the parameters [math]\displaystyle{ h }[/math] and [math]\displaystyle{ h_2 }[/math], as shown in Figure 4, are:
- [math]\displaystyle{ h = - \left ( \frac{R + r_{\rm i}}{2} \right ) . \sin \theta_{\rm L} }[/math]
- [math]\displaystyle{ h_2 = - \left ( \frac{R + r_{\rm i}}{2} \right ) . \sin \theta_{\rm T} }[/math]
The area of the circular sector, [math]\displaystyle{ A_{\rm Sect} }[/math], is:
- [math]\displaystyle{ A_{\rm Sect} = \frac{(\theta_{\rm T} - \theta_{\rm L}}{2} . (R^2 - r_{\rm i}^2) }[/math]
The slurry toe parameter [math]\displaystyle{ \theta_{\rm L} }[/math] cannot be algebraically isolated in the above equations. Therefore, an iterative numerical method is used to solve the value of [math]\displaystyle{ \theta_{\rm L} }[/math] that yields the required value of [math]\displaystyle{ A_x }[/math].
Charge density
The masses of balls, [math]\displaystyle{ m_{\rm B} }[/math] (t), and coarse rocks, [math]\displaystyle{ m_{\rm R} }[/math] (t), in the charge are:
- [math]\displaystyle{ m_{\rm B} =J_{\rm B}.V_{\rm C}.(1 - \varepsilon). \rho_{\rm B} }[/math]
- [math]\displaystyle{ m_{\rm R} = \rho_{\rm R}.V_{\rm C}. \big (J_{\rm T}(1 - \varepsilon) - J_{\rm B}(1 - \varepsilon) \big ) }[/math]
where:
- [math]\displaystyle{ J_{\rm B} }[/math] is the ball filling (v/v)
- [math]\displaystyle{ V_{\rm C} }[/math] is the volume of of the cylindrical section of the mill (m3)
- [math]\displaystyle{ \varepsilon }[/math] is the charge void fraction, typically 0.4 (v/v)
- [math]\displaystyle{ \rho_{\rm B} }[/math] is the Specific Gravity or density of the balls (- or t/m3)
- [math]\displaystyle{ \rho_{\rm R} }[/math] is the Specific Gravity or density of the rock in the charge (- or t/m3)
The volume of of the cylindrical section of the mill ([math]\displaystyle{ V_{\rm C} }[/math]) is:
- [math]\displaystyle{ V_{\rm C} = \pi R^2 L }[/math]
The charge density, [math]\displaystyle{ \rho_{\rm c} }[/math] (t/m3), excluding slurry, is then:
- [math]\displaystyle{ \rho_{\rm c} = \frac{m_{\rm B} + m_{\rm R}}{J_{\rm T} V_{\rm C}} }[/math]
The apparent density of slurry within the charge, [math]\displaystyle{ \rho'_c }[/math] (t/m3), is:
- [math]\displaystyle{ \rho'_c = \varepsilon.\rho_{\rm s} }[/math]
where [math]\displaystyle{ \rho_{\rm s} }[/math] is the density of slurry (t/m3). The value of [math]\displaystyle{ \rho_{\rm s} }[/math] is computed as:
- [math]\displaystyle{ \rho_{\rm s} = S_{\rm V}.(\rho_{\rm R} - 1) + \rho_{\rm L} }[/math]
where [math]\displaystyle{ \rho_{\rm L} }[/math] is the density of liquids (t/m3) and [math]\displaystyle{ S_{\rm V} }[/math] is the volume fraction of solids in the slurry (v/v). [math]\displaystyle{ S_{\rm V} }[/math] is calculated from the mass fraction of solids in the slurry, [math]\displaystyle{ S }[/math] (w/w), as:
- [math]\displaystyle{ S_{\rm V} = \frac{S}{\rho_{\rm R} \left ( \dfrac{S}{\rho_{\rm R}} + \dfrac{1 - S}{\rho_{\rm L}} \right )} }[/math]
No-load power
The no-load power ([math]\displaystyle{ P_{\rm N} }[/math]) is estimated as:
- [math]\displaystyle{ P_{\rm N} = \text{Motor loss factor (kW/kW)} \times P_{\rm max} }[/math]
where [math]\displaystyle{ P_{\rm max} }[/math] is the maximum power draw of the installed drive motor.
The motor loss factor may be obtained from drive vendor specifications or selected from the table below:
Table 1. Typical motor loss factors (after Hilden and Powell (2018))[1] Drive Type Motor loss factor Range (%) Average (%) Gearless GMD 3.2 - 4.9 3.9 VSD LS synchronous 4.36 - 5.26 4.8 VSD with SER 5.79 - 7.11 6.4 VSD HS asynchronous 5.6 - 6.62 6.1
Excel
The Hilden and Powell mill power model may be invoked from the Excel formula bar with the following function call:
=mdMillPower_HildenPowell(Parameters as Range)
Invoking the function with no arguments will print Help text associated with the model, including a link to this page.
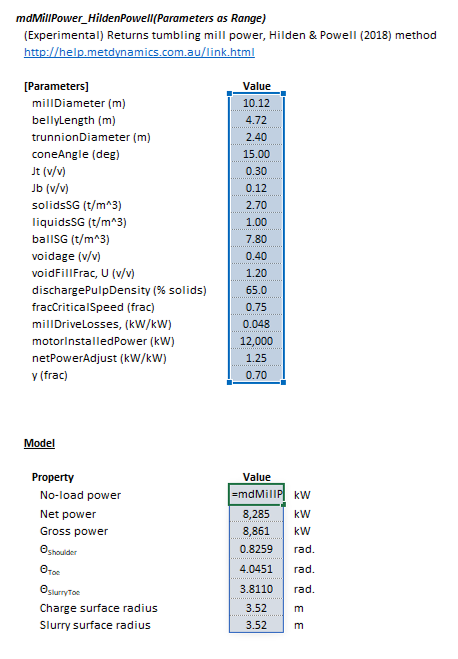
The Parameters array and model results are defined below in matrix notation, along with an example image showing the selection of the same arrays in the Excel interface:
|
SysCAD
The Hilden and Powell power model is an optional calculation for tumbling mill units. If selected, the input and display parameters below are shown.
| Tag (Long/Short) | Input / Display | Description/Calculated Variables/Options |
|---|---|---|
| HildenPowell | ||
| HelpLink | Opens a link to this page using the system default web browser. Note: Internet access is required. | |
| MillDiameter | Display | Diameter of the mill (inside liners). |
| BellyLength | Display | Length of the cylindrical section (belly) of the mill (inside liners). |
| TrunnionDiameter | Display | Diameter of the trunnion (inside liners). |
| ConeAngle | Display | Angular displacement of the cone surface from the vertical direction. |
| Jt | Display | Volumetric fraction of the mill occupied by balls and coarse rock (including voids). |
| BallLoadVol | Display | Volumetric fraction of the mill occupied by balls (including voids). |
| SolidsSG | Display | Specific Gravity or density of solids. |
| BallSG | Display | Specific Gravity or density of balls. |
| LiquidsSG | Display | Specific Gravity or density of liquids. |
| Voidage | Input/Display | Volumetric fraction of interstitial void space in the charge. Usually 0.4. Note: The Dynamic Perfect Mixing ball mill model uses Shi's dynamic charge porosity estimation to align power draw predictions with the adopted slurry filling approach. |
| U | Display | Volumetric fraction of interstitial grinding media voidage occupied by slurry. |
| Cw | Display | Mass fraction of solids in discharge slurry. |
| FracCS | Display | Fraction critical speed of the mill. |
| MillDriveLosses | Input | Mill drive motor power loss factor. |
| MotorInstalledPower | Input | Maximum power draw of installed mill motor. |
| NetPowerAdjust | Input | Lumped calibration parameter accounting for power losses. Found to be a value of 1.26 for industrial mills. |
| y | Input | Profile shape factor. |
| ThetaShoulder | Display | Angle of the charge shoulder. |
| ThetaToe | Display | Angle of the charge toe. |
| ThetaSlurryToe | Display | Angle of the toes of the slurry component |
| ChargeSurfaceRadius | Display | Radius of the inner surface of the charge. |
| SlurrySurfaceRadius | Display | Radius of the inner surface of the slurry component. |
| NoLoadPower | Display | Power input to the motor when the mill is empty (no balls, rocks or slurry). |
| NetPower | Display | Charge motion power, including losses. |
| GrossPower | Display | Power input to the motor. |
See also
References
- ↑ 1.0 1.1 Hilden, M.M. and Powell, M.S., 2018. A model of SAG mill power incorporating slurry filling and its application to real-time mill performance analysis. Paper presented at Comminution '18, Cape Town, South Africa, April 16-19, 2018.
- ↑ 2.0 2.1 2.2 2.3 Morrell, S., 1996. Power draw of wet tumbling mills and its relationship to charge dynamics. Pt. 1: a continuum approach to mathematical modelling of mill power draw. Transactions of the Institution of Mining and Metallurgy. Section C. Mineral Processing and Extractive Metallurgy, 105.
- ↑ Morrell, S., 2016. Modelling the influence on power draw of the slurry phase in Autogenous (AG), Semi-autogenous (SAG) and ball mills. Minerals Engineering, 89, pp.148-156.


