imported>Scott.Munro |
imported>Scott.Munro |
| Line 14: |
Line 14: |
| == Model theory == | | == Model theory == |
|
| |
|
| | {{Restricted content}} |
| | |
| | <hide> |
| [[File:TumblingMillMediaTraj2.png|thumb|625px|Figure 2. Geometric diagram of an outer media element resting on a lifter bar in a tumbling mill at the point of equilibrium (after Powell, 1991).{{Powell (1991)}}]] | | [[File:TumblingMillMediaTraj2.png|thumb|625px|Figure 2. Geometric diagram of an outer media element resting on a lifter bar in a tumbling mill at the point of equilibrium (after Powell, 1991).{{Powell (1991)}}]] |
|
| |
|
| Line 275: |
Line 278: |
| :<math>(v_{x{\rm E}},\, v_{y{\rm E}}) = (v_{x{\rm L}}, \; v_{y{\rm L}} - gt)</math> | | :<math>(v_{x{\rm E}},\, v_{y{\rm E}}) = (v_{x{\rm L}}, \; v_{y{\rm L}} - gt)</math> |
|
| |
|
| == Additional notes == | | === Additional notes === |
|
| |
|
| {| style="float:right; margin-left: 20px;" | | {| style="float:right; margin-left: 20px;" |
| Line 282: |
Line 285: |
| |} | | |} |
|
| |
|
| === Friction estimates === | | ==== Friction estimates ==== |
|
| |
|
| Powell's (1991) experimental work separately investigated the coefficients of static and kinetic friction between a media element and a lifter bar. The findings suggest: | | Powell's (1991) experimental work separately investigated the coefficients of static and kinetic friction between a media element and a lifter bar. The findings suggest: |
| Line 292: |
Line 295: |
| Adequate estimates of the coefficients of friction for simulation purposes may be 0 or 0.05 for <math>\mu_{\rm s}</math> and 0.19 for <math>\mu_{\rm k}</math>, but is left to user discretion. | | Adequate estimates of the coefficients of friction for simulation purposes may be 0 or 0.05 for <math>\mu_{\rm s}</math> and 0.19 for <math>\mu_{\rm k}</math>, but is left to user discretion. |
|
| |
|
| === Extracting lifter geometry === | | ==== Extracting lifter geometry ==== |
|
| |
|
| Modern mill interior laser scanning devices and/or design drawings provide accurate parametric maps of lifter bar geometry, which may be used to quantify the lifter height (<math>h</math>), lifter width (<math>2y</math>) and lifter face angle (<math>\rho</math>) properties for media trajectory simulation. | | Modern mill interior laser scanning devices and/or design drawings provide accurate parametric maps of lifter bar geometry, which may be used to quantify the lifter height (<math>h</math>), lifter width (<math>2y</math>) and lifter face angle (<math>\rho</math>) properties for media trajectory simulation. |
| Line 308: |
Line 311: |
| <br> | | <br> |
| <br> | | <br> |
| | </hide> |
|
| |
|
| == Excel == | | == Excel == |
Revision as of 11:19, 4 December 2024
Description
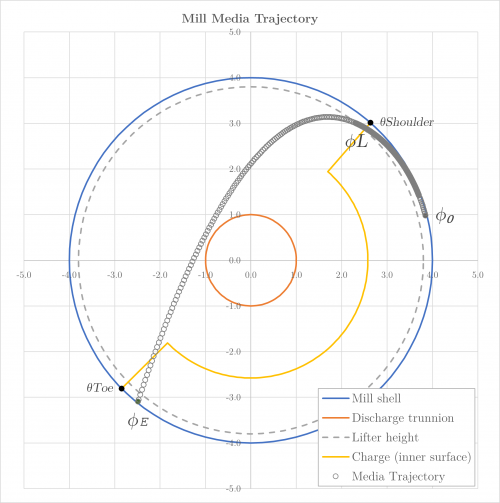
This article describes Powell's (1991) method for predicting the trajectory of the outer media elements in a tumbling mill.[1]
The approach predicts the point of impact of media elements projected into free flight after transit down a lifter bar surface, based on element size, lifter bar geometry, mill diameter and mill rotational speed.
The tumbling mill media trajectory model is particularly useful when combined with an estimate of charge position (e.g. Morrell's method), which allows analyses such as:
- Identifying and mitigating the risks of shell liner damage from media impact through lifter bar (or mill) design
- Monitoring trajectory and point of impact changes with charge level, mill speed or liner and lifter bar wear in operational mills
- Limiting the maximum operating speed (and hence power and throughput) in a mill simulation or process control sub-systems
Model theory
 This content is available to registered users. Please log in to view. This content is available to registered users. Please log in to view.
|
Excel
The tumbling mill media trajectory model may be invoked from the Excel formula bar with the following function call:
=mdMillPower_MillMediaTrajectory(Parameters as Range)
Invoking the function with no arguments will print Help text associated with the model, including a link to this page.
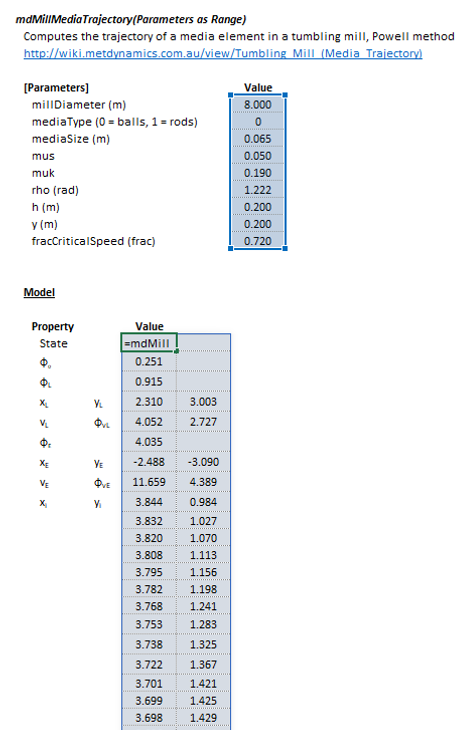
The Parameters array and model results are defined below in matrix notation, along with an example image showing the selection of the same arrays in the Excel interface:
- [math]\displaystyle{ Parameters=
\begin{bmatrix}
D\text{ (m)}\\
\text{Media type}\\
d\text{ (m)}\\
\mu_{\rm s}\\
\mu_{\rm k}\\
\rho\text{ (rad)}\\
h\text{ (m)}\\
y\text{ (m)}\\
C_{\rm s} (frac)
\end{bmatrix},\;\;\;\;\;\;
mdMillPower\_MillMediaTrajectory=
\begin{bmatrix}
\begin{bmatrix}
\text{State} & -\\
\end{bmatrix}\\
\begin{bmatrix}
\phi_0\text{ (rad)} & -\\
\end{bmatrix}\\
\begin{bmatrix}
\phi_{\rm L}\text{ (rad)} & -\\
\end{bmatrix}\\
\begin{bmatrix}
x_{\rm L} \text{ (m)} & y_{\rm L} \text{ (m)}\\
v_{\rm L} \text{ (m)} & \phi_{v{\rm L}} \text{ (rad)}\\
\end{bmatrix}\\
\begin{bmatrix}
\phi_{\rm E}\text{ (rad)} & -\\
\end{bmatrix}\\
\begin{bmatrix}
x_{\rm E} \text{ (m)} & y_{\rm E} \text{ (m)}\\
v_{\rm E} \text{ (m)} & \phi_{v{\rm E}} \text{ (rad)}\\
\end{bmatrix}\\
\begin{bmatrix}
x_0 \text{ (m)} & y_0 \text{ (m)}\\
\vdots & \vdots\\
x_n \text{ (m)} & y_n \text{ (m)}\\
\end{bmatrix}\\
\end{bmatrix}\;\;\;\;\;\;
}[/math]
where:
- [math]\displaystyle{ D }[/math] is the mill diameter inside liners (m), i.e. [math]\displaystyle{ D = 2R }[/math]
- [math]\displaystyle{ d }[/math] is the media element diameter (m), i.e. [math]\displaystyle{ d = 2a }[/math]
- [math]\displaystyle{ \text{Media type} }[/math] is the type of media element, balls or rods (0 = Balls, 1 = Rods)
- [math]\displaystyle{ C_{\rm s} }[/math] is the fraction critical speed of the mill (frac)
and:
- [math]\displaystyle{ \text{State} }[/math] is a text string that describes the motion of the media element
- [math]\displaystyle{ n }[/math] is the number of trajectory points for plotting
|
 Figure 7. Example showing the selection of the Parameters (blue frame), and Results (light blue frame) arrays in Excel. |
SysCAD
The media trajectory model is an optional calculation for tumbling mill units. If selected, the input and display parameters below are shown.
| Tag (Long/Short)
|
Input / Display
|
Description/Calculated Variables/Options
|
| MediaTraj
|
| HelpLink
|

|
Opens a link to this page using the system default web browser. Note: Internet access is required.
|
| Requirements
|
| MillDiameter
|
Input/Display
|
Diameter of the mill (inside liners).
|
| FracCS
|
Input/Display
|
Fraction critical speed of the mill.
|
| MediaType
|
Ball/Rod
|
Type of media element, balls or rods.
|
| MediaSize
|
Display
|
Diameter of the media element.
|
| mus
|
Input
|
Coefficient of static friction.
|
| muk
|
Input
|
Coefficient of kinematic friction.
|
| rho
|
Input
|
Lifter face angle, angle between the face surface and the base of the lifter bar.
|
| h
|
Input
|
Height of the lifter bar.
|
| 2y
|
Input
|
Width of the lifter bar.
|
| Results
|
| PointOfEquilibrium
|
| PositionAngle / Phi
|
Display
|
Angular position of the point of equilibrium.
|
| LeavesLifter
|
| PositionAngle / Phi
|
Display
|
Angular position of the point where the media element leaves the lifter.
|
| X
|
Display
|
Cartesian x coordinate of the point where the media element leaves the lifter.
|
| Y
|
Display
|
Cartesian y coordinate of the point where the media element leaves the lifter.
|
| Velocity / V
|
Display
|
Velocity of the media element at the point where it leaves the lifter.
|
| VelocityAngle / PhiV
|
Display
|
Angular direction of the velocity of the media element at the point where it leaves the lifter.
|
| ImpactsShell
|
| PositionAngle / Phi
|
Display
|
Angular position of the point where the media element impacts the mill shell.
|
| X
|
Display
|
Cartesian x coordinate of the point where the media element impacts the mill shell.
|
| Y
|
Display
|
Cartesian y coordinate of the point where the media element impacts the mill shell.
|
| Velocity / V
|
Display
|
Velocity of the media element at the point where it impacts the mill shell.
|
| VelocityAngle / PhiV
|
Display
|
Angular direction of the velocity of the media element at the point where it impacts the mill shell.
|
| State
|
Display
|
Text description of the motion of the media element. Possible values are:
- "Element is projected into free flight from point of equilibrium."
- "Element slides to end of the lifter and is then projected into free flight."
- "Element slides and is projected into free flight before the end of the lifter."
- "Element rolls to the end of the lifter and is projected into free flight."
- "Element rolls then slides to the end of the lifter before being projected into free flight."
- "Element rolls then slides and is projected into free flight before the end of the lifter."
- "Element rolls and is projected into free flight before the end of the lifter."
|
| Trajectory
|
| ShowTrajectory
|
CheckBox
|
If enabled, the (x, y) coordinate data of the element trajectory is displayed below.
|
| TrajectoryData
|

|
Copies the full set of trajectory coordinates to the Windows clipboard in CSV format.
|
| Point, X, Y
|
Display
|
X and Y coordinates of the media element trajectory, from the point of equilibrium to point of impact with the mill shell. Only visible if ShowTrajectory is enabled above.
|
See also
References
- ↑ Powell, M.S., 1991. The effect of liner design on the motion of the outer grinding elements in a rotary mill. International Journal of Mineral Processing, 31(3-4), pp.163-193.

