Blasting (KCO): Difference between revisions
Jump to navigation
Jump to search
imported>Scott.Munro m (→Model theory) |
imported>Scott.Munro mNo edit summary |
||
| (One intermediate revision by the same user not shown) | |||
| Line 5: | Line 5: | ||
== Model theory == | == Model theory == | ||
{{Restricted content}} | |||
<hide> | |||
</hide><div class="user-show"> | |||
=== Swebrec distribution === | === Swebrec distribution === | ||
</div><hide> | |||
[[File:BlastingKCO4.png|thumb|425px|Figure 1. Schematic of blast design geometry (after Bergman, 2005).{{Bergman (2005)}}]] | [[File:BlastingKCO4.png|thumb|425px|Figure 1. Schematic of blast design geometry (after Bergman, 2005).{{Bergman (2005)}}]] | ||
| Line 24: | Line 29: | ||
Figure 1 outlines the primary blast design dimensions relevant to the KCO model. | Figure 1 outlines the primary blast design dimensions relevant to the KCO model. | ||
</hide><div class="user-show"> | |||
=== Maximum block size, ''x''<sub>max</sub> === | === Maximum block size, ''x''<sub>max</sub> === | ||
</div><hide> | |||
The maximum block size is the smallest value of the ''in situ'' block size, the blast-hole burden, <math>B</math>, and the spacing, <math>S</math>, (m), i.e.: | The maximum block size is the smallest value of the ''in situ'' block size, the blast-hole burden, <math>B</math>, and the spacing, <math>S</math>, (m), i.e.: | ||
| Line 30: | Line 37: | ||
:<math>x_{\rm max} = \min \{ \textit{in}\text{ }\textit{situ}\text{ block size}, S, B \}</math> | :<math>x_{\rm max} = \min \{ \textit{in}\text{ }\textit{situ}\text{ block size}, S, B \}</math> | ||
</hide><div class="user-show"> | |||
=== Mean size parameter, ''x''<sub>50</sub> === | === Mean size parameter, ''x''<sub>50</sub> === | ||
</div><hide> | |||
The mean size of the distribution, <math>x_{50}</math> (mm), is estimated by: | The mean size of the distribution, <math>x_{50}</math> (mm), is estimated by: | ||
| Line 42: | Line 51: | ||
* <math>q</math> is the specific charge (kg/m<sup>3</sup>) | * <math>q</math> is the specific charge (kg/m<sup>3</sup>) | ||
* <math>g(n) = 1</math> is assumed | * <math>g(n) = 1</math> is assumed | ||
* The 10 factor converts Ouchterlony's '' | * The 10 factor converts Ouchterlony's ''centimeter'' units to ''millimeters''. | ||
The rock mass factor, <math>A</math> is: | The rock mass factor, <math>A</math> is: | ||
| Line 62: | Line 71: | ||
:<math>\mathit{JF} = \mathit{JPS} + \mathit{JPA}</math> | :<math>\mathit{JF} = \mathit{JPS} + \mathit{JPA}</math> | ||
where the joint plane spacing, <math>\mathit{JF}</math>, is related to the | where the joint plane spacing, <math>\mathit{JF}</math>, is related to the average joint spacing, <math>S_{\rm J}</math> (m), by: | ||
:<math>\mathit{JPS} = | :<math>\mathit{JPS} = | ||
| Line 99: | Line 108: | ||
where <math>E</math> is Young's Modulus (GPa) and <math>\sigma_{\rm c}</math> is the compressive strength of the rock (MPa). | where <math>E</math> is Young's Modulus (GPa) and <math>\sigma_{\rm c}</math> is the compressive strength of the rock (MPa). | ||
</hide><div class="user-show"> | |||
=== Curve-undulation exponent, ''b'' === | === Curve-undulation exponent, ''b'' === | ||
</div><hide> | |||
The curve-undulation exponent <math>b</math> is determined from: | The curve-undulation exponent <math>b</math> is determined from: | ||
| Line 116: | Line 127: | ||
* <math>H</math> is the bench height or hole depth (m) | * <math>H</math> is the bench height or hole depth (m) | ||
* <math>\mathit{SD}</math> is the standard deviation of drilling accuracy (m). | * <math>\mathit{SD}</math> is the standard deviation of drilling accuracy (m). | ||
</hide> | |||
== Excel == | == Excel == | ||
Latest revision as of 08:34, 1 May 2025
Description
This article describes the Kuznetsov–Cunningham–Ouchterlony (KCO) model (Ouchterlony, 2005) for predicting rock fragmentation by blasting.[1]
Model theory
Swebrec distribution
Maximum block size, xmax
Mean size parameter, x50
Curve-undulation exponent, b
Excel
The KCO blasting model may be invoked from the Excel formula bar with the following function call:
=mdUnit_Blasting_KCO(Parameters as Range, Size as Range)
Invoking the function with no arguments will print Help text associated with the model, including a link to this page.
Inputs
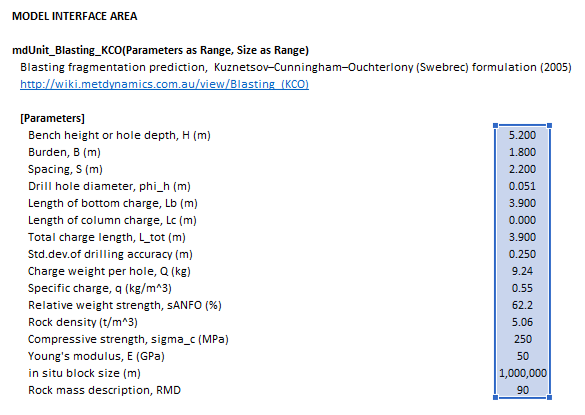
The required inputs are defined below in matrix notation with elements corresponding to cells in Excel row ([math]\displaystyle{ i }[/math]) x column ([math]\displaystyle{ j }[/math]) format:
- [math]\displaystyle{ Parameters= \begin{bmatrix} H\text{ (m)}\\ B\text{ (m)}\\ S\text{ (m)}\\ \varnothing_{\rm h}\text{ (m)}\\ L_{\rm b}\text{ (m)}\\ L_{\rm c}\text{ (m)}\\ L_{\rm Tot}\text{ (m)}\\ \mathit{SD}\text{ (m)}\\ Q\text{ (kg)}\\ q\text{ (kg/m}^3\text{)}\\ s_{\rm ANFO}\text{ (}%\text{)}\\ \rho\text{ (t/m}^3\text{)}\\ \sigma_{\rm c}\text{ (MPa)}\\ E\text{ (GPa)}\\ \textit{In}\text{ }\textit{situ}\text{ block size (m)}\\ \mathit{RMD}\\ \end{bmatrix},\;\;\;\;\;\; Size = \begin{bmatrix} d_{1}\text{ (mm)}\\ \vdots\\ d_p\text{ (mm)}\\ \end{bmatrix} }[/math]
Results
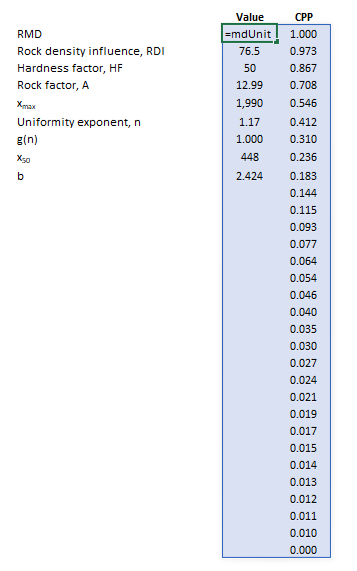
The results are displayed in Excel as an array corresponding to the matrix notation below:
- [math]\displaystyle{ \mathit{mdUnit\_Blasting\_KCO} = \begin{bmatrix} \begin{bmatrix} \mathit{RMD}\\ \mathit{RDI}\\ \mathit{HF}\\ x_{\rm max}\text{ (mm)}\\ n\\ g(n)\\ x_{50}\text{ (mm)}\\ b\\ \end{bmatrix} & \begin{array}{c} \begin{bmatrix} \mathit{P}_1\text{ (w/w)}\\ \vdots\\ \mathit{P}_p\text{ (w/w)} \end{bmatrix} \\ \\ \\ \\ \end{array} \end{bmatrix} }[/math]
Example
The images below show the selection of input arrays and output results in the Excel interface.
See also
References
- ↑ Ouchterlony, F., 2005. The Swebrec© function: linking fragmentation by blasting and crushing. Mining Technology, 114(1), pp.29-44.


