Time Series Analysis (Moving Average Filters): Difference between revisions
imported>Scott.Munro m (Text replacement - "\mathit{LRMA}" to "{\rm LRMA}") |
imported>Scott.Munro m (→Model theory) |
||
| Line 8: | Line 8: | ||
== Model theory == | == Model theory == | ||
{{ | === Simple moving average === | ||
The simple moving average (SMA) at element <math>t</math> of a data series is the unweighted mean of the previous <math>k</math> values, or the previous <math>t</math> values if <math>t<k</math>.<ref>Wikipedia Contributors (2024). ''Moving average''. [online] Wikipedia. Available at: https://en.wikipedia.org/wiki/Moving_average [Accessed 8 Jun. 2024].</ref> That is: | |||
:<math> | |||
\mathit{SMA}_{k,t} = | |||
\begin{cases} | |||
{\dfrac {1}{k}}\sum\limits_{i=t-k+1}^{t}p_{i} & t\geq k\\ | |||
{\dfrac {1}{t}}\sum\limits_{i=1}^{t}p_{i} & t<k\\ | |||
\end{cases} | |||
</math> | |||
where <math>p_1,p_2,\dots,p_t</math> are the data points to average. | |||
=== Exponential moving average === | |||
The Exponential Moving Average (EMA), or exponential smoothing, of a data series at element <math>t</math> is:<ref>Wikipedia Contributors (2024). ''Exponential smoothing''. [online] Wikipedia. Available at: https://en.wikipedia.org/wiki/Exponential_smoothing [Accessed 8 Jun. 2024].</ref> | |||
:<math>\mathit{EMA}_{\alpha,t} = \alpha \cdot p_t + (1 - \alpha) \cdot \mathit{EMA}_{\alpha,t-1}, \quad t>1</math> | |||
where <math>\alpha</math> is the smoothing factor. | |||
=== Linear regression moving average === | |||
A Linear Regression Moving Average (LRMA) fits a straight line to a moving window of data points with width <math>k</math>. | |||
The LRMA at element <math>t</math> over the window of <math>k</math> elements is calculated from: | |||
:<math>\mathit{LRMA}_{k,t} = a + b \cdot t</math> | |||
where <math>a</math> (intercept) and <math>b</math> (slope) are determined by minimising the sum of squared residuals of the data points <math>(t-k+1, P_{t-k+1}),(t-k+2, P_{t-k+2}),\dots,(t,P_t)</math>. | |||
The coefficients <math>a</math> and <math>b</math> can be directly calculated from:<ref>Wikipedia Contributors (2024). ''Simple linear regression''. [online] Wikipedia. Available at: https://en.wikipedia.org/wiki/Simple_linear_regression [Accessed 8 Jun. 2024].</ref> | |||
:<math> | |||
\begin{aligned} | |||
a &= \dfrac{\sum\limits_{i=1}^{k} p_{t-k+i} - b \sum\limits_{i=1}^{k} i}{k}\\ | |||
b &= \dfrac{k \sum\limits_{i=1}^{k} i p_{t-k+i} - \sum\limits_{i=1}^{k} i \sum\limits_{i=1}^{k} p_{t-k+i}}{k \sum\limits_{i=1}^{k} i^2 - \left( \sum\limits_{i=1}^{k} i \right)^2} | |||
\end{aligned} | |||
</math> | |||
for <math>t>1</math> and <math>k>2</math>. | |||
The Linear Regression Moving Average method may alternatively be referred to as the ''Least Squares Moving Average''. | |||
== Excel == | == Excel == | ||
| Line 44: | Line 87: | ||
\mathit{mdTimeSeries\_SMA} & = | \mathit{mdTimeSeries\_SMA} & = | ||
\begin{bmatrix} | \begin{bmatrix} | ||
{ | \mathit{SMA}_{k,1}\\ | ||
\vdots\\ | \vdots\\ | ||
{ | \mathit{SMA}_{k,n}\\ | ||
\end{bmatrix} | \end{bmatrix} | ||
\end{align} | \end{align} | ||
| Line 52: | Line 95: | ||
|- style="vertical-align:top;" | |- style="vertical-align:top;" | ||
|colspan="2"| | |colspan="2"| | ||
where | where <math>n</math> is the number of data points. | ||
|} | |} | ||
|} | |} | ||
| Line 90: | Line 129: | ||
\mathit{mdTimeSeries\_EMA} & = | \mathit{mdTimeSeries\_EMA} & = | ||
\begin{bmatrix} | \begin{bmatrix} | ||
{ | \mathit{EMA}_{\alpha,1}\\ | ||
\vdots\\ | \vdots\\ | ||
{ | \mathit{EMA}_{\alpha,n}\\ | ||
\end{bmatrix} | \end{bmatrix} | ||
\end{align} | \end{align} | ||
| Line 98: | Line 137: | ||
|- style="vertical-align:top;" | |- style="vertical-align:top;" | ||
|colspan="2"| | |colspan="2"| | ||
|} | |} | ||
|} | |} | ||
| Line 136: | Line 171: | ||
\mathit{mdTimeSeries\_LRMA} & = | \mathit{mdTimeSeries\_LRMA} & = | ||
\begin{bmatrix} | \begin{bmatrix} | ||
{ | \mathit{LRMA}_{k,1}\\ | ||
\vdots\\ | \vdots\\ | ||
{ | \mathit{LRMA}_{k,n}\\ | ||
\end{bmatrix} | \end{bmatrix} | ||
\end{align} | \end{align} | ||
| Line 144: | Line 179: | ||
|- style="vertical-align:top;" | |- style="vertical-align:top;" | ||
|colspan="2"| | |colspan="2"| | ||
|} | |} | ||
|} | |} | ||
Latest revision as of 14:15, 8 June 2024
Description
This article describes several filters for the analysis of time series data, including:
- Simple Moving Average (SMA)
- Exponential Moving Average (EMA)
- Linear Regression Moving Average (LRMA)
Model theory
Simple moving average
The simple moving average (SMA) at element of a data series is the unweighted mean of the previous values, or the previous values if .[1] That is:


where are the data points to average.

Exponential moving average
The Exponential Moving Average (EMA), or exponential smoothing, of a data series at element is:[2]

where is the smoothing factor.

Linear regression moving average
A Linear Regression Moving Average (LRMA) fits a straight line to a moving window of data points with width .
The LRMA at element over the window of elements is calculated from:

where (intercept) and (slope) are determined by minimising the sum of squared residuals of the data points .


The coefficients and can be directly calculated from:[3]

for and .


The Linear Regression Moving Average method may alternatively be referred to as the Least Squares Moving Average.
Excel
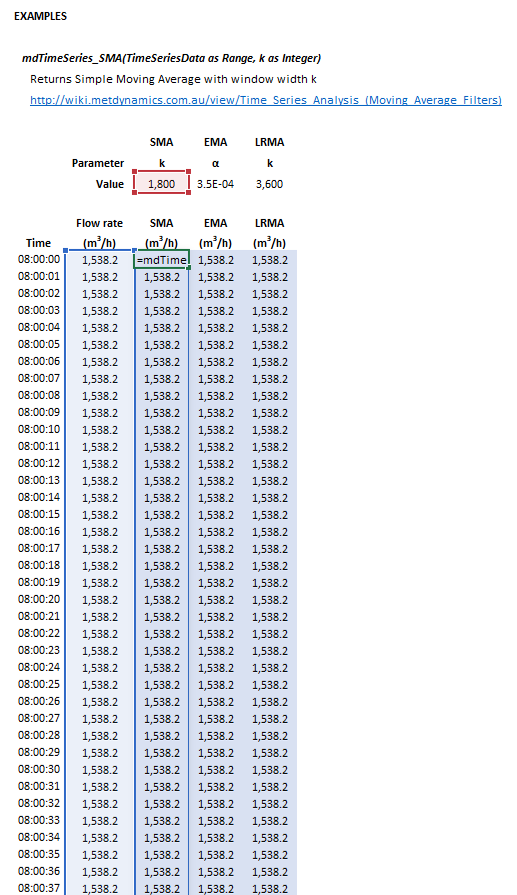 Figure 1. Example showing the selection of the TimeSeriesData (blue frame), k (red frame) and Results (light blue frame) arrays in Excel, for the Simple Moving Average (SMA) case.

The Simple Moving Average (SMA) filter may be invoked from the Excel formula bar with the following function calls:
=mdTimeSeries_SMA(TimeSeriesData as Range, k as Integer)
Invoking the function with no arguments will print Help text associated with the model, including a link to this page.
The input parameters and calculation results are defined below in matrix notation, along with an example image showing the selection of the same cells and arrays in the Excel interface:
| ||||
![{\displaystyle {\begin{aligned}{\mathit {TimeSeriesData}}&={\begin{bmatrix}p_{1}\\\vdots \\p_{n}\\\end{bmatrix}}\\\\{\mathit {k}}&={\big [}k{\big ]}\\\end{aligned}}}](https://wikimedia.org/api/rest_v1/media/math/render/svg/6b28e2120a171598923d69773303f39b92b50e7f)


The Exponential Moving Average (EMA) filter may be invoked from the Excel formula bar with the following function calls:
=mdTimeSeries_EMA(TimeSeriesData as Range, alpha as Double)
Invoking the function with no arguments will print Help text associated with the model, including a link to this page.
The input parameters and calculation results are defined below in matrix notation, along with an example image showing the selection of the same cells and arrays in the Excel interface:
| ||||
![{\displaystyle {\begin{aligned}{\mathit {TimeSeriesData}}&={\begin{bmatrix}p_{1}\\\vdots \\p_{n}\\\end{bmatrix}}\\\\{\mathit {alpha}}&={\big [}\alpha {\big ]}\\\end{aligned}}}](https://wikimedia.org/api/rest_v1/media/math/render/svg/3be19fe46c02c30dd4565149fe9921098e45b84c)

The Linear Regression Moving Average (LRMA) filter may be invoked from the Excel formula bar with the following function calls:
=mdTimeSeries_LRMA(TimeSeriesData as Range, k as Integer)
Invoking the function with no arguments will print Help text associated with the model, including a link to this page.
The input parameters and calculation results are defined below in matrix notation, along with an example image showing the selection of the same cells and arrays in the Excel interface:
| ||||

References
- ↑ Wikipedia Contributors (2024). Moving average. [online] Wikipedia. Available at: https://en.wikipedia.org/wiki/Moving_average [Accessed 8 Jun. 2024].
- ↑ Wikipedia Contributors (2024). Exponential smoothing. [online] Wikipedia. Available at: https://en.wikipedia.org/wiki/Exponential_smoothing [Accessed 8 Jun. 2024].
- ↑ Wikipedia Contributors (2024). Simple linear regression. [online] Wikipedia. Available at: https://en.wikipedia.org/wiki/Simple_linear_regression [Accessed 8 Jun. 2024].