Partition (Size, Whiten and White): Difference between revisions
Scott Munro (talk | contribs) m (1 revision imported) |
imported>Scott.Munro m (→Model theory) |
||
| (6 intermediate revisions by 3 users not shown) | |||
| Line 7: | Line 7: | ||
== Model theory == | == Model theory == | ||
{{Restricted content}} | |||
<hide> | |||
[[File:PartitionWhitenWhite1.png|thumb|450px|Figure 1. Screen partitions to oversize, with <math>D_1=50\text{ mm}</math>, <math>D_2=20\text{ mm}</math>, <math>R_{\rm f}=0.2</math> and <math>\lambda=0.2</math>. Note how the particle aspect ratio, <math>d_{\rm AR}</math>, shifts the partition curve, allowing irregular particles to pass slotted apertures that would otherwise be retained.]] | [[File:PartitionWhitenWhite1.png|thumb|450px|Figure 1. Screen partitions to oversize, with <math>D_1=50\text{ mm}</math>, <math>D_2=20\text{ mm}</math>, <math>R_{\rm f}=0.2</math> and <math>\lambda=0.2</math>. Note how the particle aspect ratio, <math>d_{\rm AR}</math>, shifts the partition curve, allowing irregular particles to pass slotted apertures that would otherwise be retained.]] | ||
The Whiten and | The Whiten and White expression for recovery to screen oversize is: | ||
{{Model theory (Text, Whiten and White Partition Curve)}} | |||
</hide><div class="user-show"> | |||
=== Particle aspect ratio === | |||
</div><hide> | |||
{{Model theory (Text, Dehghani Particle Aspect Ratio)}} | |||
</hide><div class="user-show"> | |||
=== Partition averaging === | |||
</div><hide> | |||
{{Model theory (Text, Whiten Partition Averaging)}} | |||
</hide><div class="user-show"> | |||
=== Particle entrainment === | |||
</div><hide> | |||
{{Model theory (Text, Firth Particle Entrainment)}} | |||
</hide> | |||
== Excel == | == Excel == | ||
| Line 60: | Line 39: | ||
The Whiten and White partition model may be invoked from the Excel formula bar with the following function call: | The Whiten and White partition model may be invoked from the Excel formula bar with the following function call: | ||
<syntaxhighlight lang="vb">=mdPartition_WhitenWhite( | <syntaxhighlight lang="vb">=mdPartition_WhitenWhite(Size as Range, d1 as Double, d2 as Double, nLLfo as Double, Optional Rf as Double = 0, Optional lambda as Double = 0, Optional particleAR as Double = 1)</syntaxhighlight> | ||
{{Excel (Text, Help, No Arguments)}} | {{Excel (Text, Help, No Arguments)}} | ||
| Line 71: | Line 50: | ||
:<math> | :<math> | ||
\begin{align} | \begin{align} | ||
\mathit{Size} & = | |||
\begin{bmatrix} | \begin{bmatrix} | ||
s_1\text{ (mm)}\\ | |||
\vdots\\ | \vdots\\ | ||
s_n\text{ (mm)}\\ | |||
\end{bmatrix}\\ | \end{bmatrix}\\ | ||
\\ | \\ | ||
| Line 85: | Line 64: | ||
particleAR & = \big [d_{\rm AR} \big ]\\ | particleAR & = \big [d_{\rm AR} \big ]\\ | ||
\end{align}</math> | \end{align}</math> | ||
| | | | ||
:<math> | :<math> | ||
| Line 94: | Line 74: | ||
\end{bmatrix} | \end{bmatrix} | ||
</math> | </math> | ||
| | | | ||
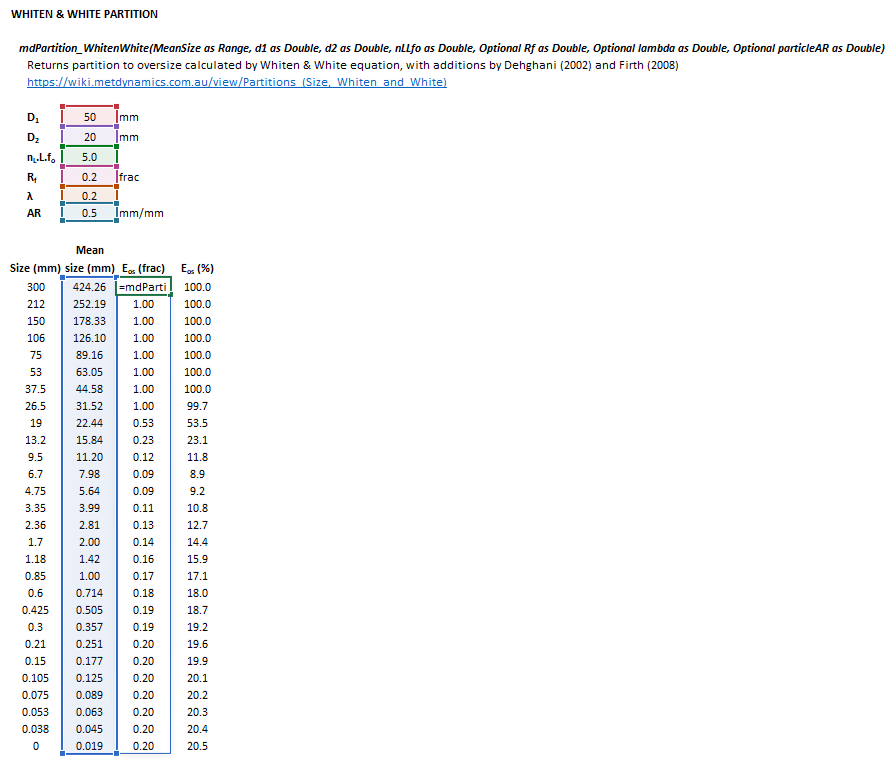
:[[File:PartitionWhitenWhite2.png|frame|Figure 2. Example showing the selection of the input parameters (shaded cells), and '''Results''' (light blue frame) array in Excel.]] | :[[File:PartitionWhitenWhite2.png|frame|Figure 2. Example showing the selection of the input parameters (shaded cells), and '''Results''' (light blue frame) array in Excel.]] | ||
|} | |} | ||
== | == See also == | ||
* [[Vibrating Screen (Whiten)]]] | |||
* [[Vibrating Screen (Metso)]] | |||
* [[Dewatering Screen (Ng)]] | |||
* [https://help.syscad.net/Met_Dynamics_-_Screen Met Dynamics - Screen (help.syscad.net)] | |||
== References == | == References == | ||
[[Category:Excel]] | [[Category:Excel]] | ||
Latest revision as of 14:16, 1 May 2025
Description
This article describes the Whiten and White (1977) expression for the partition of particles to oversize during screening.[1][2] Several additions are made to the expression to reflect fines entrainment and particle shape.
The Whiten and White formulation is convenient for modelling screens as it implicitly honours the aperture size limit on particle passage, unlike other commonly used representations such as the Whiten efficiency curve or Rosin-Rammler equation.
Model theory
Particle aspect ratio
Partition averaging
Particle entrainment
Excel
The Whiten and White partition model may be invoked from the Excel formula bar with the following function call:
=mdPartition_WhitenWhite(Size as Range, d1 as Double, d2 as Double, nLLfo as Double, Optional Rf as Double = 0, Optional lambda as Double = 0, Optional particleAR as Double = 1)
Invoking the function with no arguments will print Help text associated with the model, including a link to this page.
The input parameters and model results are defined below in matrix notation, along with an example image showing the selection of the same cells in the Excel interface:
|
|
|
See also
- Vibrating Screen (Whiten)]
- Vibrating Screen (Metso)
- Dewatering Screen (Ng)
- Met Dynamics - Screen (help.syscad.net)
References
- ↑ Whiten, W.J. and White, M.E., 1977. Modelling and simulation of high tonnage crushing plants. In: Proceedings of the 12th International Mineral Processing Congress, vol. II. Sao Paulo, pp. 148–158.
- ↑ Dehghani, A., Monhemius, A.J. and Gochin, R.J., 2002. Evaluating the Nakajima et al. model for rectangular-aperture screens. Minerals engineering, 15(12), pp.1089-1094.
