Tumbling Mill (Power, Morrell Discrete Shell): Difference between revisions
md>Scott.Munro m (→Excel) |
imported>Scott.Munro mNo edit summary |
||
| (4 intermediate revisions by 3 users not shown) | |||
| Line 8: | Line 8: | ||
== Model theory == | == Model theory == | ||
{{Restricted content}} | |||
<hide> | |||
[[File:TumblingMillPower5.png|thumb|700px|thumb|Figure 1. Grate discharge tumbling mill profile illustrating the Morrell D model's charge shape and concentric shell layers (at increments of five for clarity).<br><br>The radial position (<math>r</math>), shoulder position (<math>\theta_{S25}</math>) and toe position (<math>\theta_{T25}</math>) of shell 25 are shown as an example.]] | [[File:TumblingMillPower5.png|thumb|700px|thumb|Figure 1. Grate discharge tumbling mill profile illustrating the Morrell D model's charge shape and concentric shell layers (at increments of five for clarity).<br><br>The radial position (<math>r</math>), shoulder position (<math>\theta_{S25}</math>) and toe position (<math>\theta_{T25}</math>) of shell 25 are shown as an example.]] | ||
| Line 141: | Line 144: | ||
The position of the '''slurry pool''' level, <math>\theta_{\rm TO}</math> (rad), was assumed to be equal to the charge toe, <math>\theta_{\rm T}</math>, for grate mills. For overflow mills, a value of 3.395 radians was calculated where the trunnion radius, <math>r_{\rm t}</math>, is one quarter (0.25) of the mill radius, <math>r_{\rm m}</math>. | The position of the '''slurry pool''' level, <math>\theta_{\rm TO}</math> (rad), was assumed to be equal to the charge toe, <math>\theta_{\rm T}</math>, for grate mills. For overflow mills, a value of 3.395 radians was calculated where the trunnion radius, <math>r_{\rm t}</math>, is one quarter (0.25) of the mill radius, <math>r_{\rm m}</math>. | ||
This implementation of the Discrete Shell model improves estimation of the slurry pool position for overflow mills by adopting the approach described by Morrell (2016) and corrected by Shi (2016):{{Morrell_(2016)}}{{Shi_(2016)}} | This implementation of the Discrete Shell model improves estimation of the slurry pool position for overflow mills by adopting the approach described by Morrell (2016) and typographically corrected by Shi (2016):{{Morrell_(2016)}}{{Shi_(2016)}} | ||
:<math>\theta_{\rm TO} = \arcsin \left ( \frac{r_{\rm t} - h}{r_{\rm m}} \right )</math> | :<math>\theta_{\rm TO} = \arcsin \left ( \frac{r_{\rm t} - h}{r_{\rm m}} \right )</math> | ||
| Line 218: | Line 221: | ||
# Total power draw is finally calculated by adding the net power and no-load power values. | # Total power draw is finally calculated by adding the net power and no-load power values. | ||
== Additional notes == | === Additional notes === | ||
The Morrell D model requires an estimation of the charge particle size distribution (balls and coarse ore), and lifter geometry, both of which are typically not available during normal mill operation. In addition, the model applies a a multi-step, looping computational algorithm which makes it unsuited to spreadsheet-style calculations. For these reasons, the Morrell D model has not been tested and applied as extensively as the Morrell Continuum and Empirical models. | The Morrell D model requires an estimation of the charge particle size distribution (balls and coarse ore), and lifter geometry, both of which are typically not available during normal mill operation. In addition, the model applies a a multi-step, looping computational algorithm which makes it unsuited to spreadsheet-style calculations. For these reasons, the Morrell D model has not been tested and applied as extensively as the Morrell Continuum and Empirical models. | ||
Nevertheless, the Morrell D model may find utility when coupled with process models that predict mill load and ball particle size distributions (e.g. [[AG/SAG Mill ( | Nevertheless, the Morrell D model may find utility when coupled with process models that predict mill load and ball particle size distributions (e.g. [[AG/SAG Mill (Variable Rates)]] and [[Tumbling Mill (Media Strings)]]), and lifter wear measurements from modern laser scanning devices. | ||
Like the Continuum and Empirical models, the Morrell D model is only valid for grate discharge mills that do not exhibit a slurry pool, i.e. <math>U \leq 1</math>. The slurry pool present in overflow discharge mills is included within the model formulation via the <math>\theta_{\rm TO}</math> term, as described above. | Like the Continuum and Empirical models, the Morrell D model is only valid for grate discharge mills that do not exhibit a slurry pool, i.e. <math>U \leq 1</math>. The slurry pool present in overflow discharge mills is included within the model formulation via the <math>\theta_{\rm TO}</math> term, as described above. | ||
</hide> | |||
== Excel == | == Excel == | ||
Latest revision as of 11:15, 4 December 2024
Description
This article describes the Morrell Discrete Shell (Morrell D) method for estimating the power draw of a tumbling mill.[1] The Morrel D model adopts a more sophisticated treatment of charge dynamics than the Morrell Continuum method:
- The total charge is subdivided into discrete layers, or shells, whose size and position may individually vary due to grinding media size, mill speed, lift bar geometry and other conditions.
- The rate at which potential and kinetic energy is imparted to each shell during mill rotation is calculated separately and subsequently summed to estimate the total mill power draw.
Model theory
Excel
The Morrell Discrete Shell mill power model may be invoked from the Excel formula bar with the following function call:
=mdMillPower_MorrellD(Parameters as Range)
Invoking the function with no arguments will print Help text associated with the model, including a link to this page.
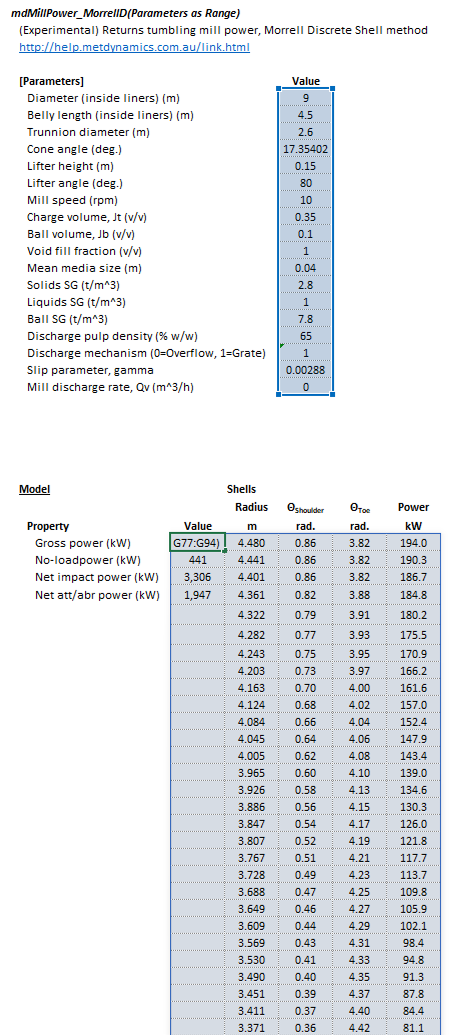
The Parameters array and model results are defined below in matrix notation, along with an example image showing the selection of the same arrays in the Excel interface:
|
|
SysCAD
The Morrell Discrete Shell power model is an optional calculation for tumbling mill units. If selected, the input and display parameters below are shown.
See also
References
- ↑ Morrell, S., 1993. The prediction of power draw in wet tumbling mills (Doctoral dissertation, University of Queensland).


