Description
This article describes methods for converting:
- Weight fraction retained to cumulative fraction passing particle size distributions
- Cumulative fraction passing to weight fraction retained particle size distributions
- Particle size distributions between different mesh series
- Particle size distribution mesh interval sizes to geometric mean sizes
- Volumetric flow rates of slurry to mass flow rates of solids and liquids
Model theory
 This section is currently under construction. Please check back later for updates and revisions. This section is currently under construction. Please check back later for updates and revisions.
|
Geometric mean size
The geometric mean size of a particle, [math]\displaystyle{ \bar d_{i} }[/math] (mm), is defined as:
- [math]\displaystyle{
\bar d_{i} =
\begin{cases}
\sqrt{2} d_1 & i=1\\
\\
\sqrt{d_{i} d_{i-1}} & 1\lt i\lt n\\
\\
0.5 d_{n-1} & i=n\\
\end{cases}
}[/math]
where:
- [math]\displaystyle{ i }[/math] is the index of the size interval, [math]\displaystyle{ i = \{1,2,\dots,n\} }[/math]
- [math]\displaystyle{ n }[/math] is the number of size intervals
- [math]\displaystyle{ d_i }[/math] is the diameter of particles retained in a mesh at size interval [math]\displaystyle{ i }[/math] (mm)
- the value of [math]\displaystyle{ d_i }[/math] decreases as [math]\displaystyle{ i }[/math] increases, i.e. [math]\displaystyle{ d_{i}\gt d_{i+1} }[/math], [math]\displaystyle{ d_1 }[/math] = top size, [math]\displaystyle{ d_n = 0 }[/math]
Excel
Retained to cumulative passing
The retained to cumulative passing method may be invoked from the Excel formula bar with the following function calls:
=mdConvert_RetToCumPass(Retained as Range)
Invoking the function with no arguments will print Help text associated with the model, including a link to this page.
The input parameters and calculation results are defined below in matrix notation, along with an example image showing the selection of the same cells and arrays in the Excel interface:
- [math]\displaystyle{
\begin{align}
\mathit{Retained} =
\begin{bmatrix}
p_1\\
\vdots\\
p_n\\
\end{bmatrix},\;\;\;\;
\end{align} }[/math]
|
[math]\displaystyle{
\begin{align}
\mathit{mdConvert\_RetToCumPass} & =
\begin{bmatrix}
P_1\\
\vdots\\
P_n\\
\end{bmatrix}\\
\end{align}
}[/math]
|
|
where:
- [math]\displaystyle{ n }[/math] is the number of data points
- [math]\displaystyle{ p }[/math] is the quantity retained on size interval [math]\displaystyle{ i }[/math] ([math]\displaystyle{ 1 \leq i \leq n }[/math])
- [math]\displaystyle{ P }[/math] is the cumulative quantity passing size interval [math]\displaystyle{ i }[/math]
|
|
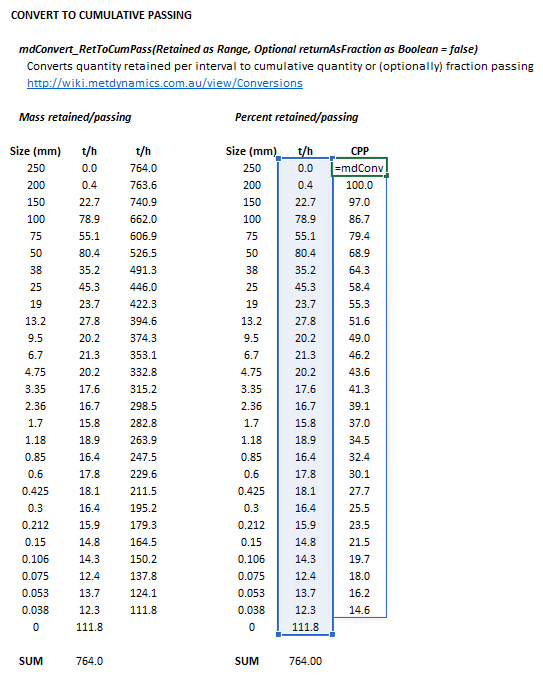 Figure 1. Example showing the selection of the Retained (blue frame) and Results (light blue frame) arrays in Excel.
|
Cumulative passing to retained
The cumulative passing to retained method may be invoked from the Excel formula bar with the following function calls:
=mdConvert_CumPassToRet(CumPassing as Range)
Invoking the function with no arguments will print Help text associated with the model, including a link to this page.
The input parameters and calculation results are defined below in matrix notation, along with an example image showing the selection of the same cells and arrays in the Excel interface:
- [math]\displaystyle{
\begin{align}
\mathit{CumPassing} =
\begin{bmatrix}
P_1\\
\vdots\\
P_n\\
\end{bmatrix},\;\;\;\;
\end{align} }[/math]
|
[math]\displaystyle{
\begin{align}
\mathit{mdConvert\_CumPassToRet} & =
\begin{bmatrix}
p_1\\
\vdots\\
p_n\\
\end{bmatrix}\\
\end{align}
}[/math]
|
|
where:
- [math]\displaystyle{ n }[/math] is the number of data points
- [math]\displaystyle{ p }[/math] is the quantity retained on size interval [math]\displaystyle{ i }[/math] ([math]\displaystyle{ 1 \leq i \leq n }[/math])
- [math]\displaystyle{ P }[/math] is the cumulative quantity passing size interval [math]\displaystyle{ i }[/math]
|
|
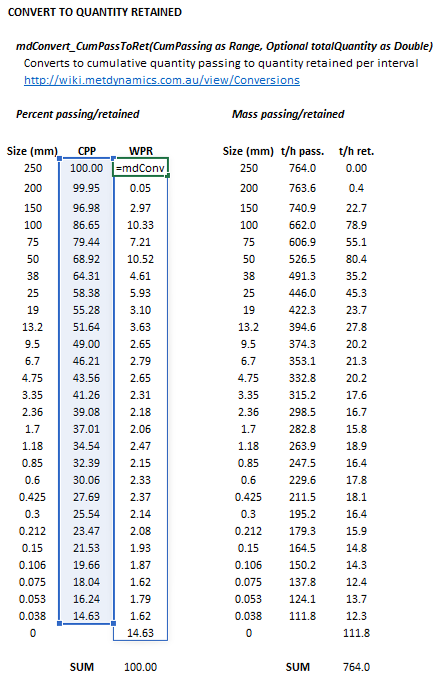 Figure 2. Example showing the selection of the CumPassing (blue frame) and Results (light blue frame) arrays in Excel.
|
Convert between meshes
The convert between meshes method may be invoked from the Excel formula bar with the following function calls:
=mdConvert_ToMesh(Size1 as Range, Dist1 as Range, Size2 as Range, Optional axesScale as Integer = 0, Optional interpMethod as Integer = 0)
Invoking the function with no arguments will print Help text associated with the model, including a link to this page.
The input parameters and calculation results are defined below in matrix notation, along with an example image showing the selection of the same cells and arrays in the Excel interface:
- [math]\displaystyle{
\begin{align}
\mathit{Size1} & =
\begin{bmatrix}
d_1\text{ (mm)}\\
\vdots\\
d_n\text{ (mm)}\\
\end{bmatrix}\\
\\
\mathit{Dist1} & =
\begin{bmatrix}
p_1\\
\vdots\\
p_n\\
\end{bmatrix}\\
\\
\mathit{Size2} & =
\begin{bmatrix}
d_1\text{ (mm)}\\
\vdots\\
d_m\text{ (mm)}\\
\end{bmatrix}\\
\\
\mathit{axesScale} & = \big [ \text{(0, 1 or 2)} \big ]\\
\\
\mathit{interpMethod} & = \big [ \text{(0 or 1)} \big ]\\
\end{align}
}[/math]
|
- [math]\displaystyle{
\begin{align}
\mathit{mdConvert\_ToMesh} & =
\begin{bmatrix}
p_1\\
\vdots\\
p_m\\
\end{bmatrix}\\
\end{align}
}[/math]
|
|
where:
- [math]\displaystyle{ n }[/math] is the number of data points in the first size distribution
- [math]\displaystyle{ m }[/math] is the number of data points in the second size distribution
- [math]\displaystyle{ d_i }[/math] is the size of the square mesh interval that feed mass is retained on (mm)
- [math]\displaystyle{ d_{i+1}\lt d_i\lt d_{i-1} }[/math], i.e. descending size order from top size ([math]\displaystyle{ d_{1} }[/math]) to sub mesh ([math]\displaystyle{ d_{n}=0 }[/math] mm)
- [math]\displaystyle{ p }[/math] is the quantity retained on a size interval
- [math]\displaystyle{ \mathit{axesScale} }[/math] selects which scaling method to apply to the axes during interpolation:
- 0 = linear (x) and linear (y) (default if omitted)
- 1 = log (x) and linear (y)
- 2 = log (x) and log (y)
- [math]\displaystyle{ \mathit{interpMethod} }[/math] selects which interpolation method to apply to the distribution during conversion:
|
|
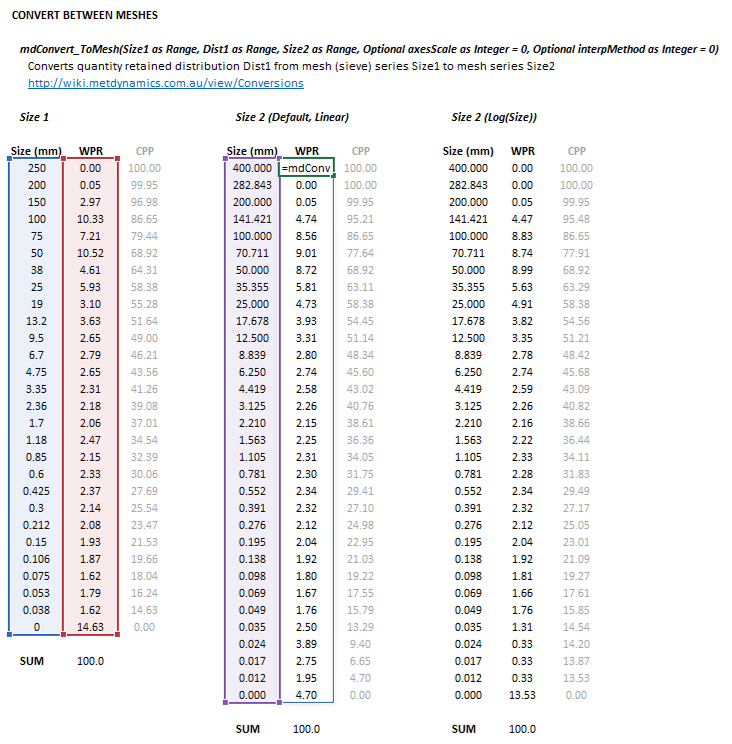 Figure 3. Example showing the selection of the Size1 (blue frame), Dist1 (red frame), Size2 (purple frame) and Results (light blue frame) arrays in Excel.
|
Geometric mean size
The geometric mean size method may be invoked from the Excel formula bar with the following function calls:
=mdConvert_ToGeoMeanSize(Size as Range)
Invoking the function with no arguments will print Help text associated with the model, including a link to this page.
The input parameters and calculation results are defined below in matrix notation, along with an example image showing the selection of the same cells and arrays in the Excel interface:
- [math]\displaystyle{
\begin{align}
\mathit{Size} =
\begin{bmatrix}
d_1\text{ (mm)}\\
\vdots\\
d_n\text{ (mm)}\\
\end{bmatrix}
\end{align} }[/math]
|
- [math]\displaystyle{
\begin{align}
\mathit{mdConvert\_ToGeoMeanSize} & =
\begin{bmatrix}
\bar d_1\\
\vdots\\
\bar d_n\\
\end{bmatrix}
\end{align}
}[/math]
|
- [math]\displaystyle{ n }[/math] is the number of data points in the first size distribution
- [math]\displaystyle{ d_i }[/math] is the size of the square mesh interval that feed mass is retained on (mm)
- [math]\displaystyle{ d_{i+1}\lt d_i\lt d_{i-1} }[/math], i.e. descending size order from top size ([math]\displaystyle{ d_{1} }[/math]) to sub mesh ([math]\displaystyle{ d_{n}=0 }[/math] mm)
- [math]\displaystyle{ \bar{d}_i }[/math] is the geometric mean size of the internal mesh series interval that mass is retained on (mm)
|
|
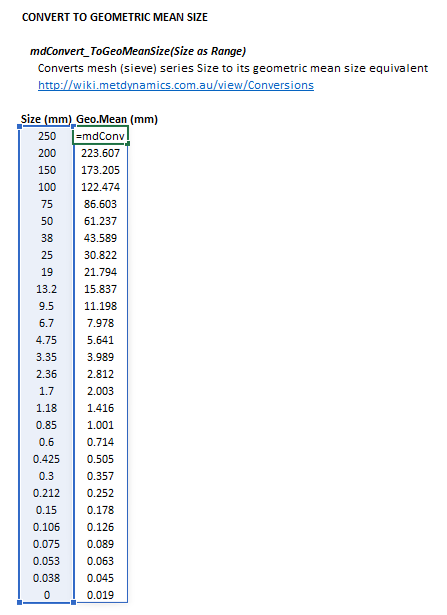 Figure 4. Example showing the selection of the Size (blue frame) and Results (light blue frame) arrays in Excel.
|
Slurry volume flow to mass flow
The slurry volume flow to mass flow method may be invoked from the Excel formula bar with the following function calls:
=mdConvert_QvToQm(Qv as Double, wtFracSolids as Double, solidsSG as Double, Optional liquidsSG as Double = 1)
Invoking the function with no arguments will print Help text associated with the model, including a link to this page.
The input parameters and calculation results are defined below in matrix notation, along with an example image showing the selection of the same cells and arrays in the Excel interface:
- [math]\displaystyle{
\begin{align}
\mathit{Qv} & = \big [ Q_{\rm V}\text{ (m}^3\text{/h)} \big ]\\
\\
\mathit{wtFracSolids} & = \big [ C_{\rm W}\text{ (w/w)} \big ]\\
\\
\mathit{solidsSG} & = \big [ \rho_{\rm S}\text{ (t/m}^3\text{)} \big ]\\
\\
\mathit{liquidsSG} & = \big [ \rho_{\rm L}\text{ (t/m}^3\text{)} \big ]\\
\end{align}
}[/math]
|
- [math]\displaystyle{
\begin{align}
\mathit{mdConvert\_QvToQm} & =
\begin{bmatrix}
(Q_{\rm M})_{\rm S}\\
(Q_{\rm M})_{\rm L}\\
\end{bmatrix}\\
\end{align}
}[/math]
|
|
where:
- [math]\displaystyle{ Q_{\rm V} }[/math] is the volumetric flow rate of slurry (m3/h)
- [math]\displaystyle{ C_{\rm W} }[/math] is the mass fraction of solids in the slurry (w/w)
- [math]\displaystyle{ \rho_{\rm S} }[/math] is the density of solids (t/m3)
- [math]\displaystyle{ \rho_{\rm L} }[/math] is the density of liquids (t/m3), default is 1.0 t/m3 if omitted
- [math]\displaystyle{ (Q_{\rm M})_{\rm S} }[/math] is the mass flow rate of solids in the slurry (t/h)
- [math]\displaystyle{ (Q_{\rm M})_{\rm L} }[/math] is the mass flow rate of liquids in the slurry (t/h)
|
|
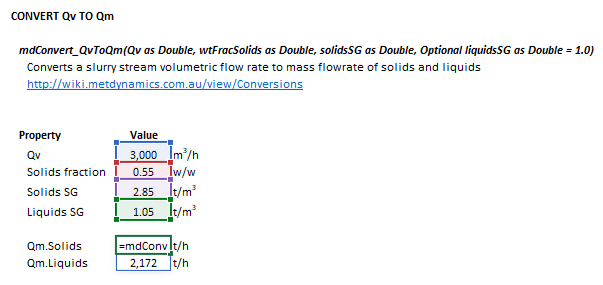 Figure 5. Example showing the selection of the Qv (shaded blue frame), wtFracSolids (shaded red frame), solidsSG (shaded purple frame), liquidsSG (shaded green frame), and Results (light blue frame) arrays in Excel.
|
References


