Tumbling Mill (Power, Morrell Empirical)
Description
This article describes the Morrell Empirical (Morrell E) method for estimating the power draw of a tumbling mill.[1]
The Morrell E model is a set of empirical equations based on the performance of the theoretical Morrell Continuum model. The model was originally intended to be simpler, and therefore easier to use in practice, than the theoretical Morrell C method.
Model theory
Morrell developed a simpler, empirical model of power input to the motor of a tumbling mill based on the theoretical Continuum approach.[1]
Morrell's Empirical relationship for tumbling mill power draw is:
- [math]\displaystyle{ \text{Gross power (kW)} = \text{No-load power} + \left (KD^{2.5}L_e \rho_c \alpha \delta \right ) }[/math]
where:
- [math]\displaystyle{ \text{No-load power} = 1.68D^{2.05} \left [\phi (0.667L_d+L \right ]^{0.82} }[/math]
- [math]\displaystyle{ \alpha = \frac{J_t(\omega - J_t)}{\omega^2} }[/math]
- [math]\displaystyle{ \omega = 2 \left (2.9863 \phi - 2.2129 \phi^2 - 0.49267 \right ) }[/math]
- [math]\displaystyle{ \delta = \phi \left ( 1 - \left [1 - \phi^{*}_{max} \right ] {\rm e}^{-19.42(\phi^*_{max} - \phi)} \right ) }[/math]
- [math]\displaystyle{ \phi^*_{max} = 0.954 - 0.135J_t }[/math]
- [math]\displaystyle{ L_e = L \left ( 1 + 2.28 J_t \left [ 1 - J_t \right ] \frac{L_d}{L}\right ) }[/math]
- [math]\displaystyle{ \rho_c = \frac{J_t \rho_o \left ( 1 = E + EUS \right ) + J_B \left ( \rho_B - \rho_o \right ) \left (1-E \right )}{J_t} + \frac{J_tEU \left (1 - S \right )}{J_t} }[/math]
and
- [math]\displaystyle{ K }[/math] is a calibration constant, [math]\displaystyle{ K=7.98 }[/math] for overflow mills and [math]\displaystyle{ K=9.10 }[/math] for grate mills
- [math]\displaystyle{ D }[/math] is mill diameter inside liners (m)
- [math]\displaystyle{ L_e }[/math] is the effective length of the mill (m)
- [math]\displaystyle{ \rho_c }[/math] is the density of the total charge (t/m3)
- [math]\displaystyle{ \phi }[/math] is fraction critical speed (frac)
- [math]\displaystyle{ L_d }[/math] is length of the cone end (m)
- [math]\displaystyle{ L }[/math] is length of the cylindrical section (belly) of the mill inside liners (m)
- [math]\displaystyle{ \alpha }[/math], [math]\displaystyle{ \omega }[/math] and [math]\displaystyle{ \delta }[/math] are empirical parameters
- [math]\displaystyle{ J_t }[/math] is the volumetric fraction of the mill occupied by balls and coarse rock (v/v)
- [math]\displaystyle{ \phi^*_{max} }[/math] is the fraction of critical speed at which power draw is maximum (frac)
- [math]\displaystyle{ \rho_o }[/math] is the density of ore (t/m3)
- [math]\displaystyle{ \rho_B }[/math] is the density of balls (t/m3)
- [math]\displaystyle{ E }[/math] is volumetric fraction of interstitial void space in the charge, typically 0.4 (v/v)
- [math]\displaystyle{ U }[/math] is the volumetric fraction of interstitial grinding media voidage occupied by slurry (v/v)
- [math]\displaystyle{ S }[/math] is the volume fraction of solids in the mill discharge (v/v)
The length of the cone end, [math]\displaystyle{ L_d }[/math] (m), is:
- [math]\displaystyle{ L_d = (r_m - r_t) \tan \alpha_{c} }[/math]
where [math]\displaystyle{ \alpha_{c} }[/math] is the cone angle, measured as the angular displacement of the cone surface from the vertical direction.
Excel
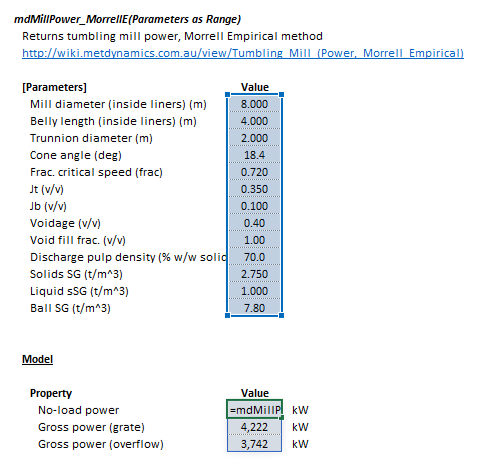
The Morrell Empirical mill power model may be invoked from the Excel formula bar with the following function call:
=mdMillPower_MorrellE(Parameters as Range)
Invoking the function with no arguments will print Help text associated with the model, including a link to this page.
The Parameters array and model results are defined below in matrix notation, along with an example image showing the selection of the same arrays in the Excel interface:
|
SysCAD
The Morrell Empirical power model is an optional calculation for tumbling mill units. If selected, the input and display parameters below are shown.

