Interpolation: Difference between revisions
Jump to navigation
Jump to search
md>Scott.Munro m (→Model theory) |
Scott Munro (talk | contribs) m (1 revision imported) |
(No difference)
| |
Revision as of 04:43, 19 May 2023
Description
This article describes linear and cubic spline data interpolation methods.
Model theory
Excel
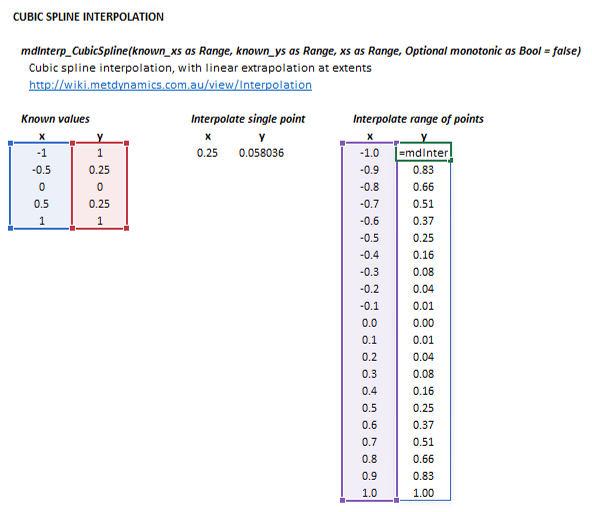
The interpolation methods may be invoked from the Excel formula bar with the following function calls:
=mdInterp_Linear(known_xs as Range, known_ys as Range, xs as Range)
and
=mdInterp_CubicSpline(known_xs as Range, known_ys as Range, xs as Range)
Invoking the function with no arguments will print Help text associated with the model, including a link to this page.
The input parameters and calculation results are defined below in matrix notation, along with an example image showing the selection of the same cells and arrays in the Excel interface:
|
| ||||
