Tumbling Mill (Slurry Flow): Difference between revisions
Jump to navigation
Jump to search
md>Scott.Munro m (→Excel) |
imported>Scott.Munro m (→Model theory) |
||
| (7 intermediate revisions by 3 users not shown) | |||
| Line 5: | Line 5: | ||
== Model theory == | == Model theory == | ||
Morrell and Stephenson suggest the total discharge flow rate of liquids plus solids of size less than <math> | {{Restricted content}} | ||
<hide> | |||
Morrell and Stephenson (1996) suggest the total discharge flow rate of liquids plus solids of size less than <math>x_{\rm m}</math> (which act like water) is the combination of discharge through the grinding media zone and slurry pool (if present): | |||
{{Model theory (Text, Slurry Flow, Morrell and Stephenson)}} | {{Model theory (Text, Slurry Flow, Morrell and Stephenson)}} | ||
| Line 11: | Line 14: | ||
The mean radial position of the grate apertures, <math>\gamma</math>, is defined as: | The mean radial position of the grate apertures, <math>\gamma</math>, is defined as: | ||
:<math>\gamma = \frac{\sum{r_ia_i}}{ | :<math>\gamma = \frac{\sum{r_ia_i}}{r_{\rm m} \sum{a_i}}</math> | ||
where: | where: | ||
* <math>a_i</math> is the open area of all holes (m<sup>2</sup>) at radial position <math>r_i</math> (m) | * <math>a_i</math> is the open area of all holes (m<sup>2</sup>) at radial position <math>r_i</math> (m) | ||
* <math> | * <math>r_{\rm m}</math> is the radius of the mill inside the liners (m) | ||
In addition, solids greater than <math>x_{\rm m}</math> but less than the grate aperture size will also discharge from the mill. To estimate total discharge flow rate, <math>Q</math> (m<sup>3</sup>/h), Morrell and Stephenson (1996) suggest the following correction: | |||
:<math>Q = k_{\rm g} (Q_{\rm m} + Q_{\rm t})</math> | |||
where <math>k_{\rm g}</math> is a factor to account for coarse material, typically taking the values shown in Table 1. | |||
:{| class="wikitable" | |||
|+ Table 1. Recommended values for <math>k_{\rm g}</math>. | |||
|- | |||
! Aperture !! <math>k_{\rm g}</math> | |||
|- | |||
| Grates only; <19mm || 1.05 - 1.1 | |||
|- | |||
| Grates only; 19mm - 28mm|| 1.1 - 1.15 | |||
|- | |||
| Grates >38mm or pebble ports || 1.15 - 1.25 | |||
|- | |||
| Pebble port open area > Grate open area|| 1.25 | |||
|} | |||
</hide> | |||
== Excel == | == Excel == | ||
| Line 36: | Line 60: | ||
A\text{ (m}^{\text{2}}\text{)}\\ | A\text{ (m}^{\text{2}}\text{)}\\ | ||
\gamma\text{ (m/m)}\\ | \gamma\text{ (m/m)}\\ | ||
r_{\rm n}\text{ (m/m)}\\ | |||
J_{\rm t}\text{ (v/v)}\\ | |||
J_{pg}\text{ (v/v)}\\ | J_{\rm pg}\text{ (v/v)}\\ | ||
k_{\rm g}\\ | |||
k_{\rm m}\\ | |||
k_{\rm t}\\ | |||
\end{bmatrix},\;\;\;\;\;\; | \end{bmatrix},\;\;\;\;\;\; | ||
mdMillSlurryFlow\_MorrellStephenson= | mdMillSlurryFlow\_MorrellStephenson= | ||
\begin{bmatrix} | \begin{bmatrix} | ||
J_{po}\text{ (v/v)}\\ | J_{\rm po}\text{ (v/v)}\\ | ||
J_{max}\text{ (v/v)}\\ | J_{\rm max}\text{ (v/v)}\\ | ||
J_{p}\text{ (v/v)}\\ | J_{p}\text{ (v/v)}\\ | ||
J_{pm}\text{ (v/v)}\\ | J_{\rm pm}\text{ (v/v)}\\ | ||
J_{pt}\text{ (v/v)}\\ | J_{\rm pt}\text{ (v/v)}\\ | ||
Q_\text{m}\text{ (m}^{\text{3}}\text{/h)}\\ | Q_\text{m}\text{ (m}^{\text{3}}\text{/h)}\\ | ||
Q_{\rm t}\text{ (m}^{\text{3}}\text{/h)}\\ | |||
Q\text{ (m}^{\text{3}}\text{/h)}\\ | Q\text{ (m}^{\text{3}}\text{/h)}\\ | ||
\end{bmatrix}\;\;\;\;\;\; | \end{bmatrix}\;\;\;\;\;\; | ||
| Line 63: | Line 87: | ||
* [[Ball Mill (Perfect Mixing, Dynamic)|Dynamic Perfect Mixing ball mill model]] | * [[Ball Mill (Perfect Mixing, Dynamic)|Dynamic Perfect Mixing ball mill model]] | ||
* [[AG/SAG Mill (Variable Rates)]] | |||
* [[AG/SAG Mill (Variable Rates, Dynamic)]] | |||
== References == | == References == | ||
[[Category:Excel]] | [[Category:Excel]] | ||
Latest revision as of 08:17, 1 May 2025
Description
This article describes the Morrell and Stephenson (1996) method for estimating the volumetric flow rate of slurry discharged from a grate discharge tumbling mill.[1]
Model theory
Excel
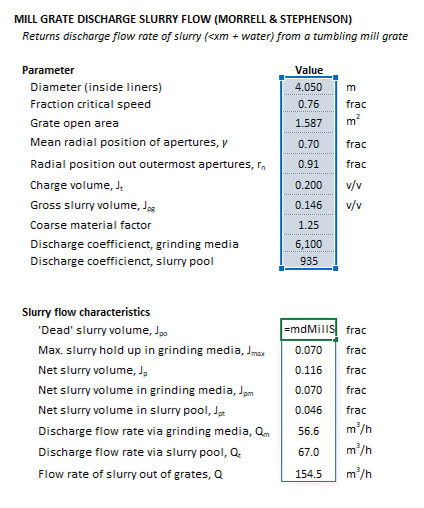
The Morrell and Stephenson grate discharge mill slurry flow model may be invoked from the Excel formula bar with the following function call:
=mdMillSlurryFlow_MorrellStephenson(Parameters as Range)
Invoking the function with no arguments will print Help text associated with the model, including a link to this page.
The Parameters array and model results are defined below in matrix notation, along with an example image showing the selection of the same arrays in the Excel interface:
|
See also
- Dynamic Perfect Mixing ball mill model
- AG/SAG Mill (Variable Rates)
- AG/SAG Mill (Variable Rates, Dynamic)
References
- ↑ Morrell, S. and Stephenson, I., 1996. Slurry discharge capacity of autogenous and semi-autogenous mills and the effect of grate design. International Journal of Mineral Processing, 46(1-2), pp.53-72.
